MATLAB App for teaching mathematical concepts
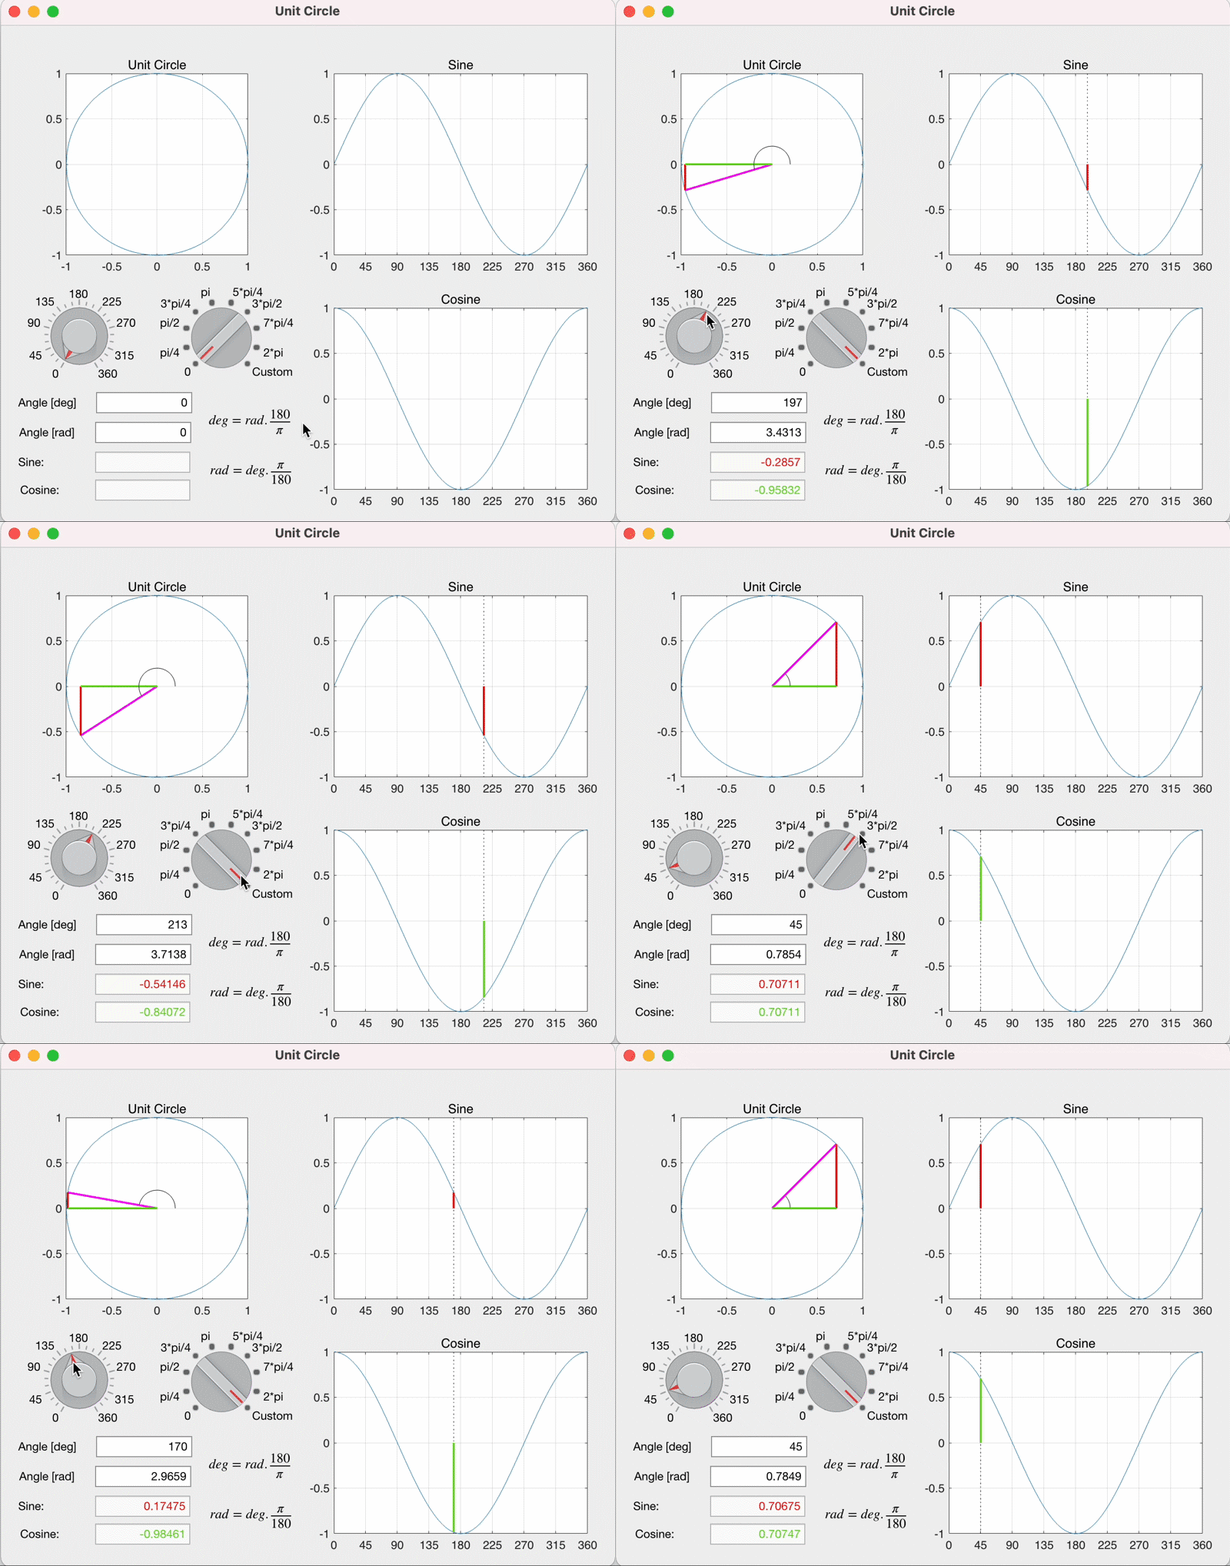
Concepts become easier to understand when they can be visualized and explored by students. Back when I first learned trigonometry in high school, my teacher would draw a unit circle on the chalkboard (yes, they were chalkboards back then). Then he would draw a set of axes to the right and another set fo axes to the bottom. They would represent the sine function and the cosine function, respectively. It actually looked something like this.

Of course, the drawings on the chalkboard never moved, but my teacher would draw a few lines with different colors to show how the values of the two functions would change with the angle of the line.
It helped me visualize the mathematical relationship, but boy, do I wish I had access to this app when I was learning trigonometry! The beauty of such an app is that the user, the student, can see how the values change based on how they change the input value. They start to understand the concept because they see the cause and effect. I like the simple option Michal includes for quickly selecting multiples of for the angles, in addition to selecting continuous angles.
You can learn all about building Apps in MATLAB, to help convey ideas more effectively or create exploratory tools.


댓글
댓글을 남기려면 링크 를 클릭하여 MathWorks 계정에 로그인하거나 계정을 새로 만드십시오.