Running a Simulation Step by Step
As you probably know, when you simulate a model, there is a lot of stuff going on that you do not see.
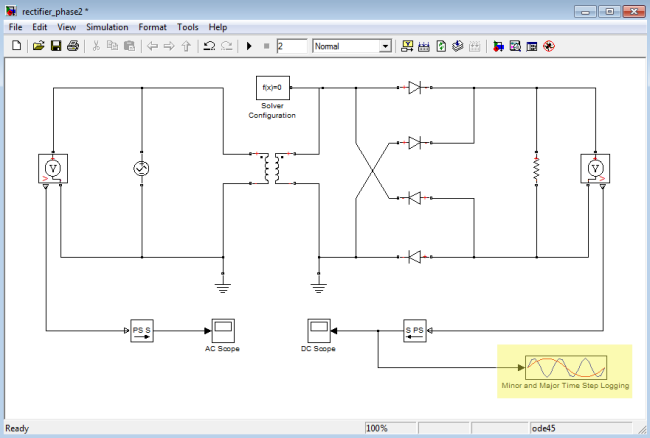
Yesterday I showed a user how to visualize the execution of a simulation step by step using the Simulink Debugger and he was very impressed. Let's take a look at the debugger animation.
Simulink Debugger Animation
If you are interested in seeing every method executed by the Simulink engine during the simulation, start the Simulink Debugger from the Tools menu. Then click on the Animation Mode button and start your simulation.

What are all those methods?
The documentation for the Debug Pointer gives a description of the rectangular patches displayed on the blocks and the meaning of their color.

If you are interested to learn more about all those steps taken by the Simulink engine, I recommend going through the documentation page How the Simulink Engine Interacts with C S-Functions.
This documentation will show you in which order those methods are executing and you will find a link describing each of them. S-functions provide all the methods used by Simulink to simulate a model, so if you understand how S-functions work, you will understand how Simulink works.
What's Next?
What I showed today is only one of the many feature of the Simulink Debugger. If you are interested in learning more about what the Simulink Debugger can do for you, let me know by leaving a comment here.
Now it's your turn
Now you can cancel your cabel/satelite subscription! Open your favorite model, get a cold beer, some snacks, and sit back to enjoy the Simulink Debugger Animation! (Can you tell it is Friday?)
- カテゴリ:
- Debugging


コメント
コメントを残すには、ここ をクリックして MathWorks アカウントにサインインするか新しい MathWorks アカウントを作成します。