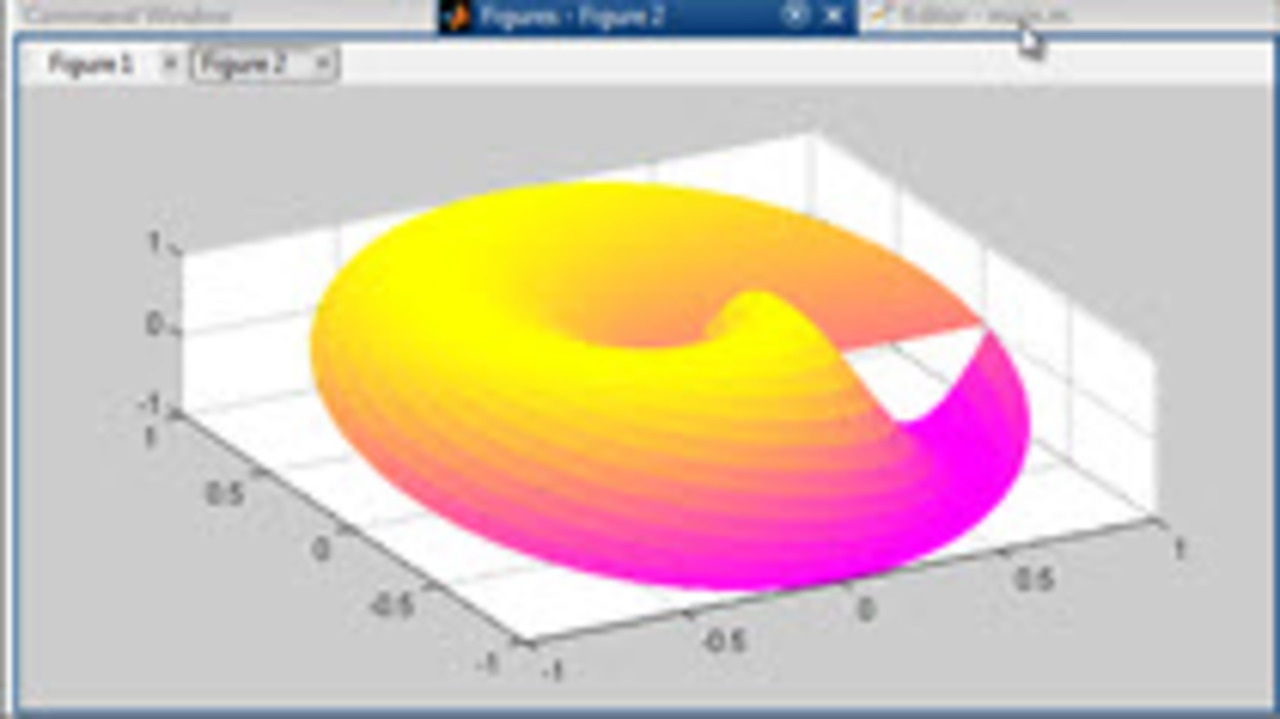
MATLAB does not have a polar surface plot built in. You can use a normal surface plot if you convert your polar data into Cartesian with the pol2cart command. We also cover how to get rid of the… 更多内容 >>

MATLAB does not have a polar surface plot built in. You can use a normal surface plot if you convert your polar data into Cartesian with the pol2cart command. We also cover how to get rid of the… 更多内容 >>
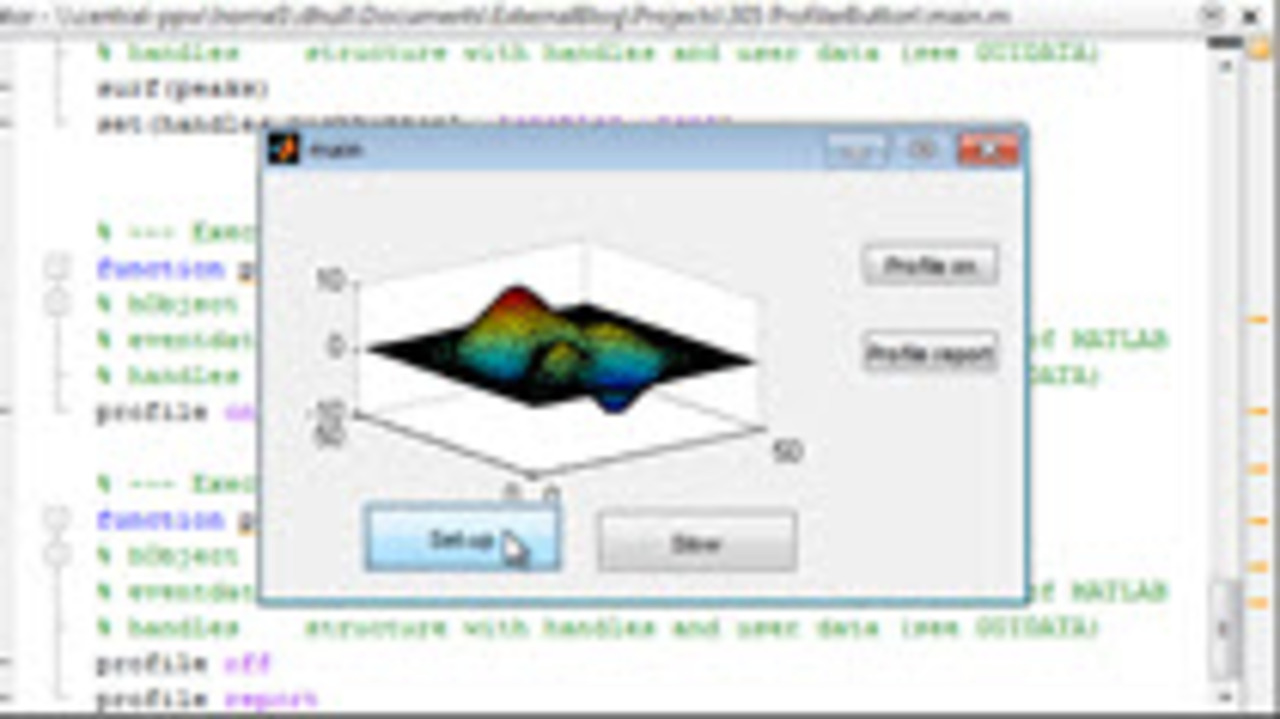
Sometimes when you are working on a User Interface you want to use the profiler to speed up the code. However, with a UI so much time can be spent by the user rather than the code of interest that… 更多内容 >>
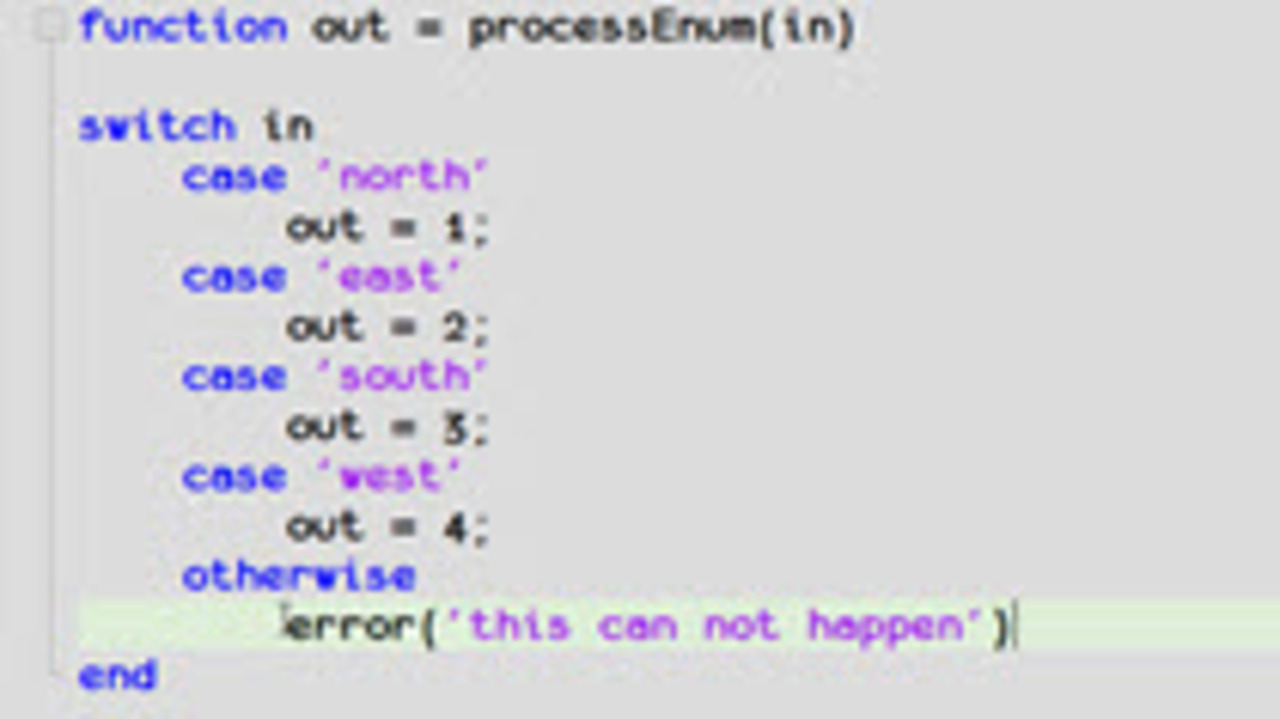
In some code there is an enumerated set of choices. People will use a switch case statement to check for all but one choice and then catch that last one in the ‘otherwise’ block of their… 更多内容 >>
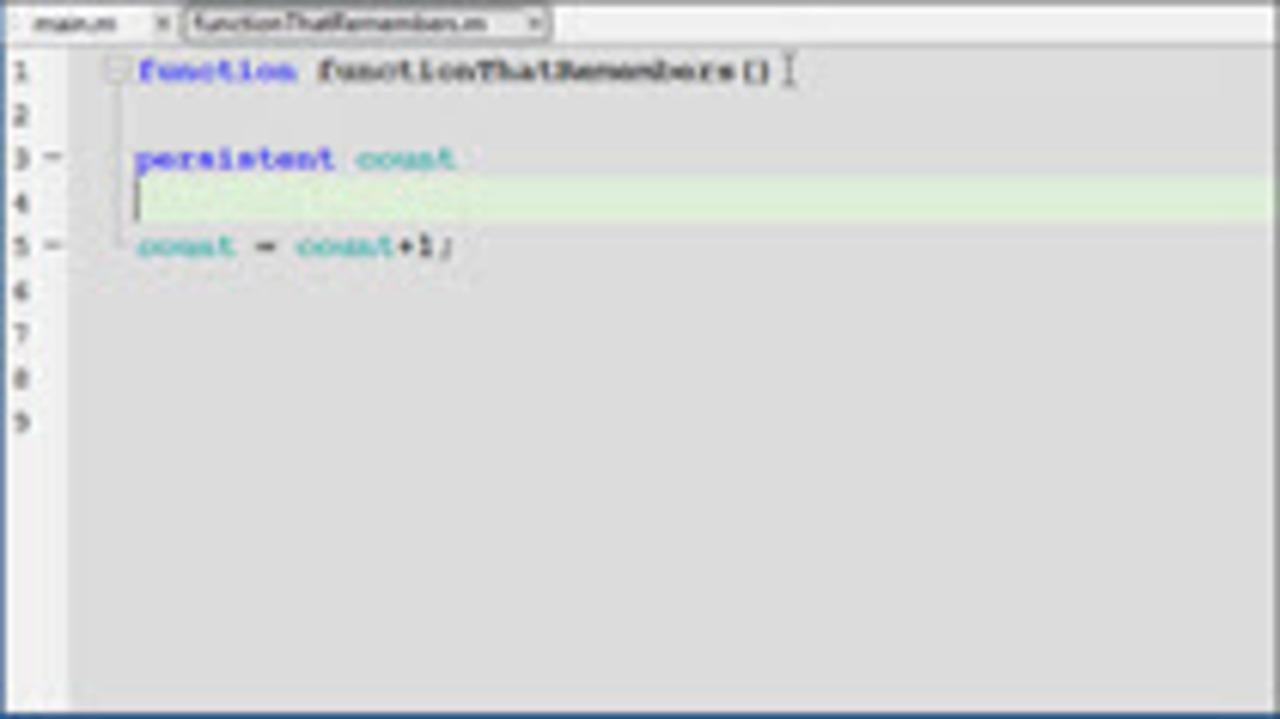
There are situations where you want MATLAB to remember the value of a variable from one call of a function to another call of that function. We show to use a persistent value to accomplish this. … 更多内容 >>
There are often small tweaks to functionality that you would like for a figure in MATLAB. This video shows how to add a button to a figure that will allow you to toggle the units of a y axes between… 更多内容 >>

A colleague was trying to draw some structures and do basic static analysis on them. He wanted to write a routine that would draw a pinned beam given the locations of the two pins. This can be done… 更多内容 >>
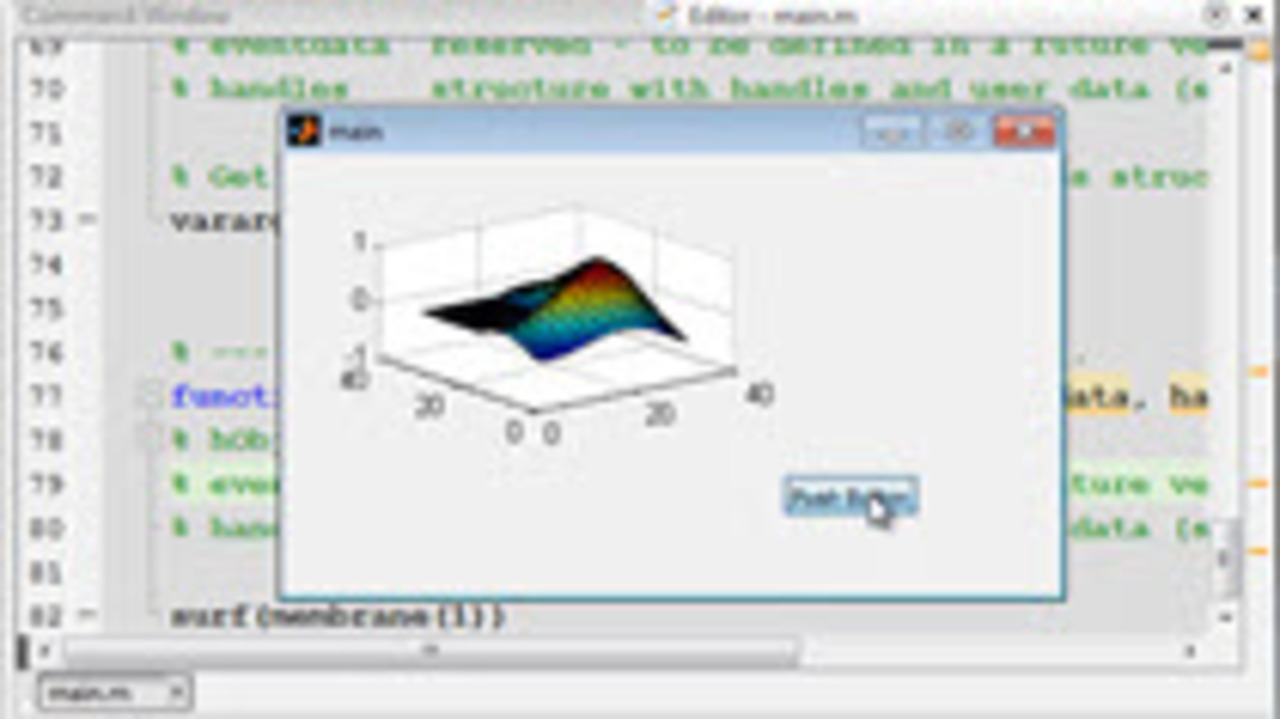
As we approach video number three hundred on this blog, I thought it was time to remake the original video that got this all started. I still refer people to it on a weekly basis. This shows you… 更多内容 >>
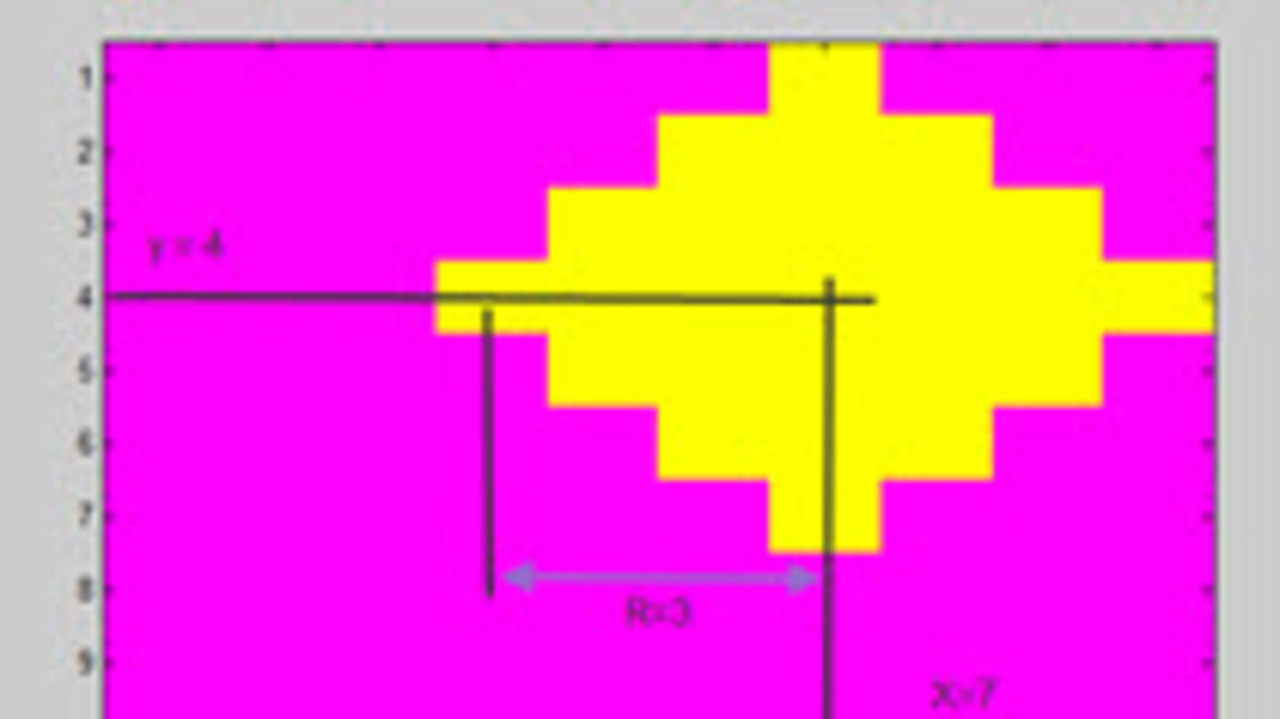
I got a quick question today on how to make a diamond appear on an image in MATLAB. This is really an exercise in indexing and for loops in MATLAB. Let’s see how you can make an image in… 更多内容 >>
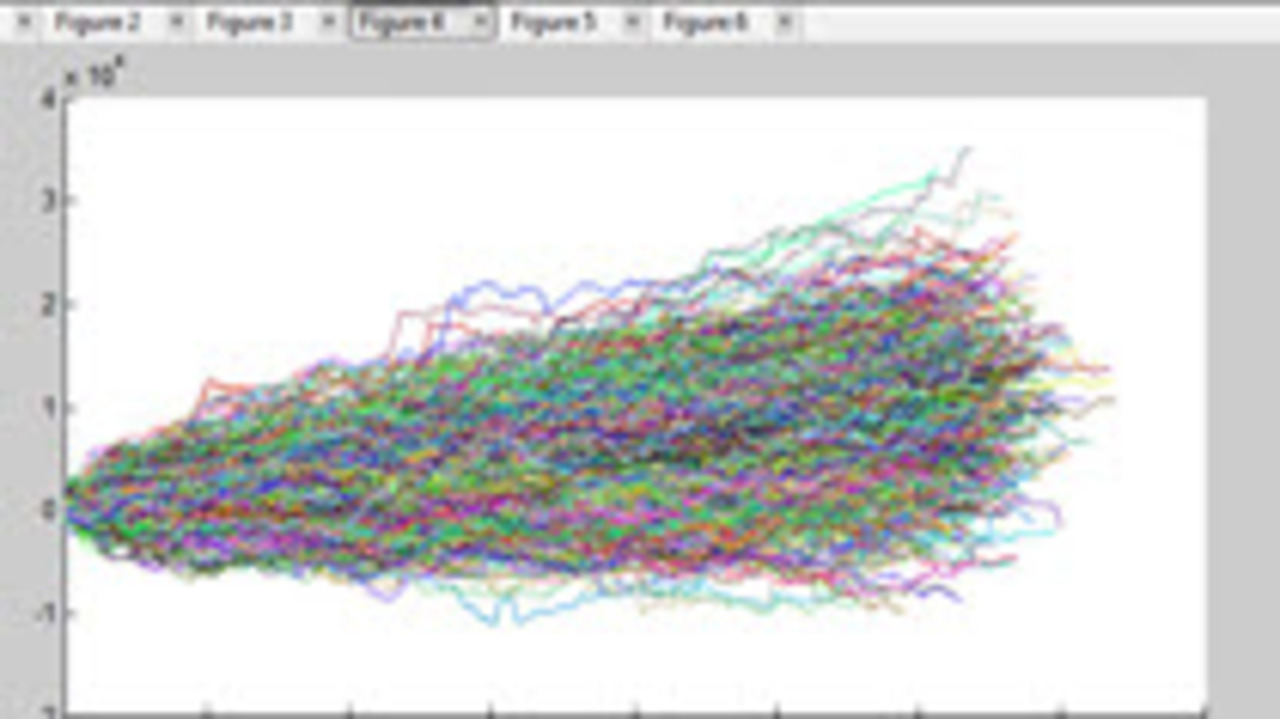
Continuing with the random walk data: We will be bootstrap sampling the prior data to get estimates of what the next series of samples could look like. if (typeof(playerLoaded) === ‘undefined’)… 更多内容 >>
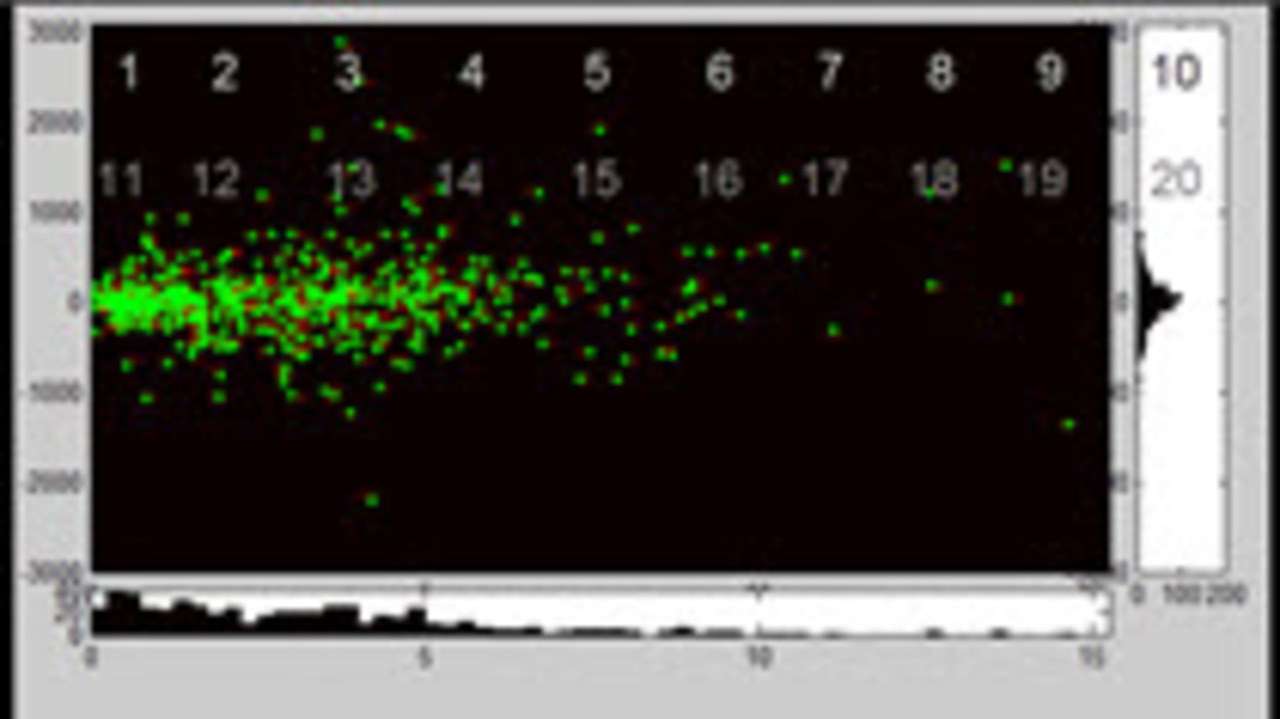
This week we do a code review of some random walk data, making a heatmap with adjoining histograms to better understand the distribution of data. It shows the implementation of visualizations… 更多内容 >>
