
Geom 2d
Sean's pick this week is geom2d by David Legland.
Working at MathWorks, I get to use MATLAB every day, learn a lot about it, and get to try everything. But one of the things I forget is the experience of someone who doesn't use it every day but occasionally needs it for a specific task. Thus, when I get the opportunity to solve a problem like this, it reminds me of my early days and reminds me what a privilege it is to have access to professional quality software.
Yesterday, one of our program managers came to my office and wanted me to create a map of the United States for her with different regions color coded. Seems straight forward right? Here's the story of the steps I took to create the map for her.
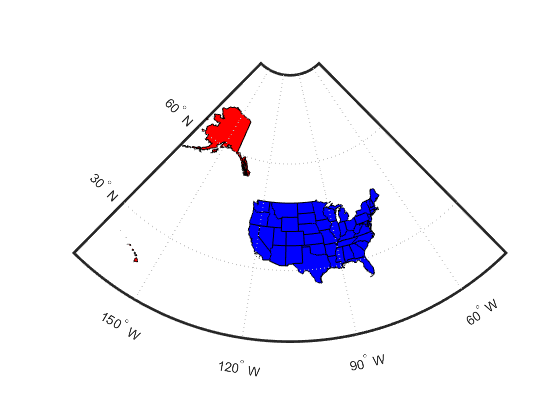
I knew off the top of my head, that usamap in the Mapping Toolbox was the function that I needed to build the map. So I went to the doc page linked above by running:
doc usamapThe third example at the bottom of the doc page was exactly what I was looking for. I almost always start with examples because it's easier to modify or delete than to add. As an added bonus, it already even excluded Alaska and Hawaii which she didn't want on her map!

I copied this example in, and ran it. I quickly realized that the line I really needed to modify was the following one; it even had a nice comment noting the current randomness.
faceColors = makesymbolspec('Polygon',...
   {'INDEX', [1 numel(states)], 'FaceColor', ...
   polcmap(numel(states))}); %NOTE - colors are random
I figured polcmap probably worked like any of the other colormap functions and takes the number of unique colors to make. My task involved six regions and so I needed six colors.
figure
polcmap6 = polcmap(6);
colormap(polcmap6)
colorbar

Minor victory!
Now I needed to index into this colormap each state's region. I asked for an Excel sheet containing the states and the region indices.

This can be easily read in with readtable.
Tstateregions = readtable('StateRegionsLookup.xlsx');Warning: Variable names were modified to make them valid MATLAB identifiers.
With the region indices, I should be able to plot the map color coded by indexing into the colormap:
figure
ax = usamap('conus');

states = shaperead('usastatelo', 'UseGeoCoords', true,...
  'Selector',...
  {@(name) ~any(strcmp(name,{'Alaska','Hawaii'})), 'Name'});

faceColors = makesymbolspec('Polygon',...
    {'INDEX', [1 numel(states)], 'FaceColor', ...
    polcmap6(Tstateregions.Region,:)});

geoshow(ax, states, 'DisplayType', 'polygon', ...
   'SymbolSpec', faceColors)


framem off
gridm off
mlabel off
plabel off

But that doesn't look right! So what went wrong, I took a look at the states and compared them:
table({states(:).Name}.', Tstateregions.State,'VariableNames',{'MATLAB','Excel'})ans =
MATLAB Excel
______________________ ________________________
'Alabama' ''Alabama''
'Arizona' ''Arizona''
'Arkansas' ''Arkansas''
'California' ''California''
'Colorado' ''Colorado''
'Connecticut' ''Connecticut''
'Delaware' ''Delaware''
'Florida' ''District of Columbia''
'Georgia' ''Florida''
'Idaho' ''Georgia''
'Illinois' ''Idaho''
'Indiana' ''Illinois''
'Iowa' ''Indiana''
'Kansas' ''Iowa''
'Kentucky' ''Kansas''
'Louisiana' ''Kentucky''
'Maine' ''Louisiana''
'Maryland' ''Maine''
'Massachusetts' ''Maryland''
'Michigan' ''Massachusetts''
'Minnesota' ''Michigan''
'Mississippi' ''Minnesota''
'Missouri' ''Mississippi''
'Montana' ''Missouri''
'Nebraska' ''Montana''
'Nevada' ''Nebraska''
'New Hampshire' ''Nevada''
'New Jersey' ''New Hampshire''
'New Mexico' ''New Jersey''
'New York' ''New Mexico''
'North Carolina' ''New York''
'North Dakota' ''North Carolina''
'Ohio' ''North Dakota''
'Oklahoma' ''Ohio''
'Oregon' ''Oklahoma''
'Pennsylvania' ''Oregon''
'Rhode Island' ''Pennsylvania''
'South Carolina' ''Rhode Island''
'South Dakota' ''South Carolina''
'Tennessee' ''South Dakota''
'Texas' ''Tennessee''
'Utah' ''Texas''
'Vermont' ''Utah''
'Virginia' ''Vermont''
'Washington' ''Virginia''
'West Virginia' ''Washington''
'Wisconsin' ''West Virginia''
'Wyoming' ''Wisconsin''
'District of Columbia' ''Wyoming''
Ahh ha! Washington DC is appended to the end of MATLAB's shipping state border file where as it's alphabetical in the Excel sheet causing an offset. Simple enough manual fix:
Tstateregions = [Tstateregions([1:7 9:end],:); Tstateregions(8,:)];
figure
ax = usamap('conus');

faceColors = makesymbolspec('Polygon',...
    {'INDEX', [1 numel(states)], 'FaceColor', ...
    polcmap6(Tstateregions.Region,:)});

geoshow(ax, states, 'DisplayType', 'polygon', ...
   'SymbolSpec', faceColors)


framem off
gridm off
mlabel off
plabel off

By now you're probably wondering what this has to do with geom2d. Well I still had to put the two letter code on each state. To do this I needed a way to identify the centroid of the polygon. I went to the File Exchange and searched for "polygon centroid", and sure enough geom2d has a function named exactly that!
for ii = 1:numel(states)
    latii = states(ii).Lat; % Remove nans indicating end of border
    lonii = states(ii).Lon;
    cent = polygonCentroid(latii(~isnan(latii)),lonii(~isnan(lonii)));
    textm(cent(1),cent(2),Tstateregions.x2letter(ii))
end

And there you have it.
The polygon centroid function is just one of dozens in this well documented and organized toolbox. There are tools for all sorts of math, aggregation and plotting of geometric primitives, e.g. polygons, lines, rays, and polynomial curves. Each group of functions has its own Contents.m file so one can quickly see all of the functions and a quick description of what they do. The functions have a full help description, many with an example. There are also a bunch of example files that have been published so you can see the example without having to run it. Overall this is a great package to have around and now it can join its older brother, geom3d with a Pick of the Week banner!
Comments
Do you ever get a random one-off task or activity that is quickly solvable in MATLAB and that makes you feel good?
Give it a try and let us know what you think here or leave a comment for David.
- Category:
- Picks


Comments
To leave a comment, please click here to sign in to your MathWorks Account or create a new one.