Jahnke and Emde, Revisited
An incredible book, published in several editions from 1909 to 1933, by German mathematicians Eugene Jahnke and Fritz Emde, contains definitions and formulas for mathematical functions, hand-calculated tables of function values, and meticulous hand-drawn 2- and 3-dimensional graphs. An English edition was published by Dover in 1945.

Contents
Jahnke and Emde Gamma Function
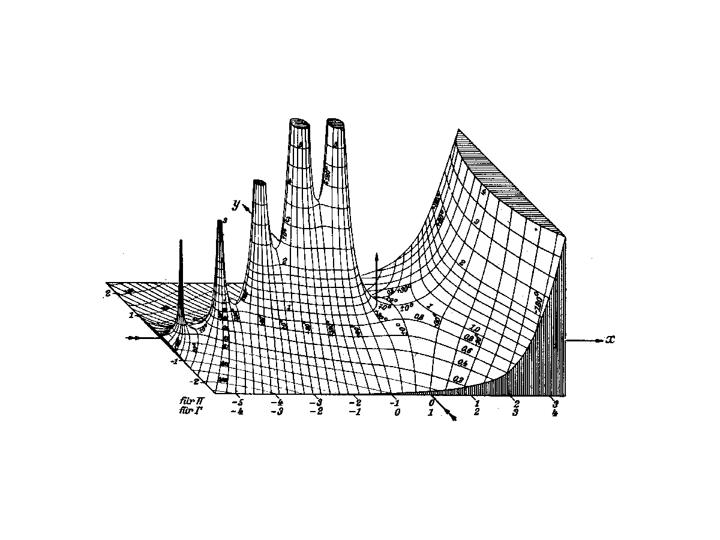
I will include only two of their illustrations in this blog. Here is one of their graphs of the gamma function in the complex plane. The surface is the magnitude of the function, with its poles at the integers on the negative real axis. The contour lines are the modulus and phase. I can't imagine how they made this plot in 1933.
MATLAB Gamma Function
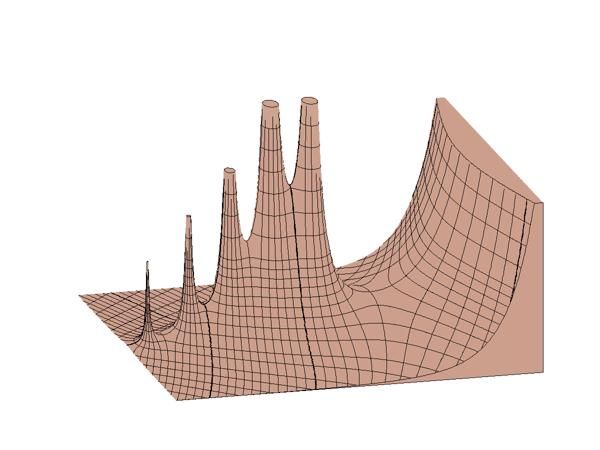
Here is my attempt to have MATLAB recreate the Jahnke and Emde plot. It is only partially successful. I do have little ellipses to cut off the spikes -- that was tricky. But I haven't begun to label the contours, or shade the edge faces.
Jahnke and Emde Bessel Function
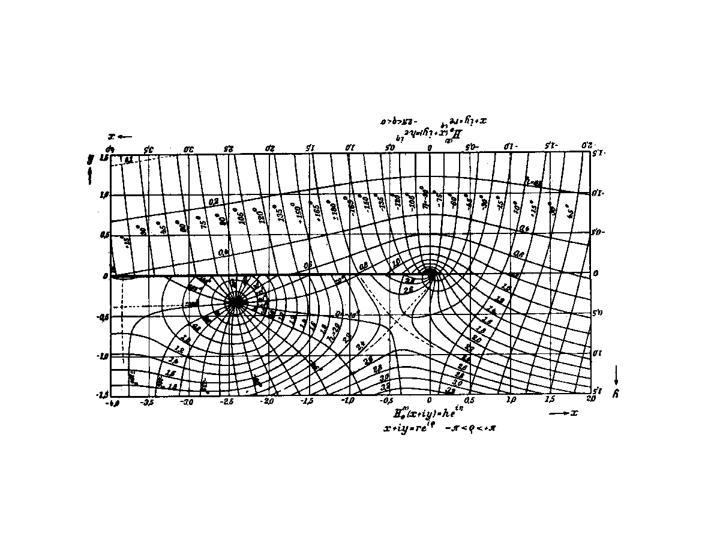
I love this plot. It is the complex-valued Bessel function of order zero, also known as the Hankel function. There is a pole, a zero, and a saddle point. Again, imagine doing this by hand. Or, having some grad student do it.
MATLAB Bessel Function
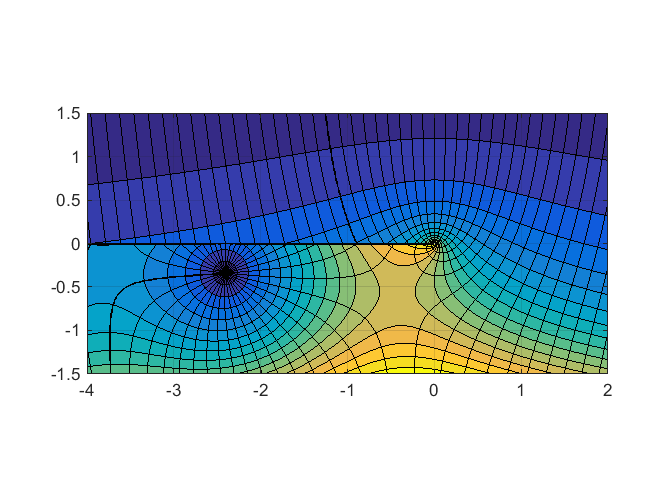
Here we can use color, and our new parula color map, in place of 3d. But we can't get the nice feel of the hand drawn lettering.
   [X,Y] = meshgrid(-4:1/128:2,-1.5:1/128:1.5);
   H = besselh(0,X+i*Y);
   s = 3.2;
   contourf(X,Y,abs(H),0:0.2:s)
   hold on
   c2 = s*(angle(H)/(2*pi)+0.5);
   r2 = s*((-180:10:180)/360+0.5);
   contour(X,Y,c2,r2,'k-')
   hold off
   axis equal
   axis tight
   grid on
Reference
Eugene Jahnke and Fritz Emde, Tables of Functions with Formulas and Curves, (4th ed.), Dover, 1945
- Category:
- History,
- People,
- Special Functions
 Cleve’s Corner: Cleve Moler on Mathematics and Computing
 The MATLAB Blog
 Guy on Simulink
 MATLAB Community
 Artificial Intelligence
 Developer Zone
 Stuart’s MATLAB Videos
 Behind the Headlines
 File Exchange Pick of the Week
 Hans on IoT
 Student Lounge
 MATLAB ユーザーコミュニティー
 Startups, Accelerators, & Entrepreneurs
 Autonomous Systems
 Quantitative Finance
 MATLAB Graphics and App Building


Comments
To leave a comment, please click here to sign in to your MathWorks Account or create a new one.