
Internet of Things – How to Get Started
I'm sure you've heard of IoT, Internet of Things. And people talk about connected devices, and getting the data from them to use in applications. I want to show you a very simple example to spark some ideas in each of you.
Contents
Example
IoT allows you access or serve data that is not local to users who want to use it. We have the ThingSpeak portion of our website that you can use to access and analyze live streamed data in the cloud. And we recently added the ability to access these same channels of information directly from a MATLAB session when you have internet access. Here's an example of some simple weather day you can access, including windspeed (mph), humidity, and temperature (F). The first thing I'll do is grab these 3 channels of information for 3 days.
data = thingSpeakRead(12397,'Fields',2:4,'NumDays',3,'OutputFormat', ...
       'TimeTable');
Let's preview the data with topkrows.
topkrows(data,8)
ans =
  8×3 timetable
         Timestamps         WindSpeedmph    Humidity    TemperatureF
    ____________________    ____________    ________    ____________
    09-Jul-2019 09:29:03        3.3            36           82.4
    09-Jul-2019 09:28:02        4.2            37           82.3
    09-Jul-2019 09:27:01          5            37           82.3
    09-Jul-2019 09:25:59        2.8            37           82.2
    09-Jul-2019 09:24:58        2.9            37           82.1
    09-Jul-2019 09:23:58        4.3            37           82.1
    09-Jul-2019 09:22:55        2.8            37           82.1
    09-Jul-2019 09:21:54        2.8            37           81.9
I asked for the data to be returned in a timetable. How many points did I collect?
numDataPoints = height(data)
numDataPoints =
        4228
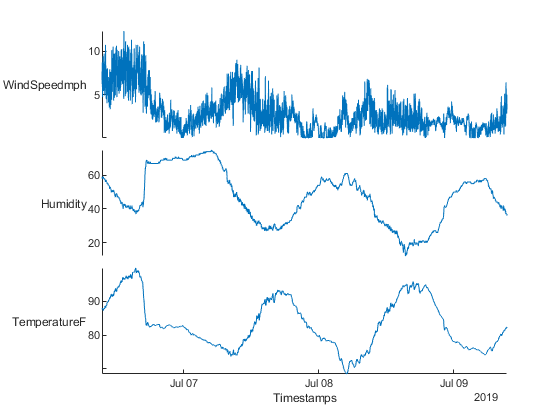
Let's look at the data now. It's interesting to compare the trends of the data we chose to view. I'm using a stackedplot
h = stackedplot(data);
IoT
If you are interested in learning more about IoT with MATLAB, I highly recommend reading Hans's blog.
Let me know how you might take advantage of ThingSpeak here.
- Category:
- IoT


Comments
To leave a comment, please click here to sign in to your MathWorks Account or create a new one.