 Cleve’s Corner: Cleve Moler on Mathematics and Computing
 The MATLAB Blog
 Guy on Simulink
 MATLAB Community
 Artificial Intelligence
 Developer Zone
 Stuart’s MATLAB Videos
 Behind the Headlines
 File Exchange Pick of the Week
 Hans on IoT
 Student Lounge
 MATLAB ユーザーコミュニティー
 Startups, Accelerators, & Entrepreneurs
 Autonomous Systems
 Quantitative Finance
 MATLAB Graphics and App Building
Remove Unneeded feval Calls
Recently I read a post about speeding up functions on Yair's blog. I'll take this opportunity, using Release 2020a, to use the updated profiler to investigate performance, particularly for the function feval.
Contents
Code - Attempt 1
I've got a simple file to evaluation a function at a bunch of points so the values can be used later, perhaps for a plot. Here's the code.
function [ptsToPlot, vals] = myCrudePlotHelperLoopFeval(fh,Nsteps,lims)
% Crude helper function to prepare function values for plotting
%
% Example:
%  fh = @(x)sqrt(abs(sin(x.^2+17)));
%  [ptsToPlot, vals] = myCrudePlotHelperLoopFeval(fh,50000,[0, pi]);
%  plot(ptsToPlot, vals)
%

arguments
    fh (1,1) function_handle;
    Nsteps (1,1) double = 100000;
    lims (1,2) double = [-pi, pi];
end


sm = min(lims);
lg = max(lims);
% Nsteps+1 = number of points to create.  1/N helps determine the stepsize.
% 100000 is far more points than we need, but I want to do a bunch of
% meaningful computation so we get a reasonable reading.

% Get x-axis for points to plot.
ptsToPlot = (sm:((lg-sm)/Nsteps):lg)';
% Compute output using feval in a loop.
for ind = 1:length(ptsToPlot)
    vals(ind,1) = feval(fh, ptsToPlot(ind));
end
I am using the Run and Time feature on the Home Toolstrip for my time measurements here.

I will call all variants of this function with the same inputs - fair's fair! First I'll set up the parameters.
Nsteps = 50000;
lims = [0 pi];
And next run the following code in the text box to the left of the Run and Time widget on the right side of the profiler:
[ptsToPlot, vals] = myCrudePlotHelperLoopFeval(fh,Nsteps,lims);
and we see this afterwards
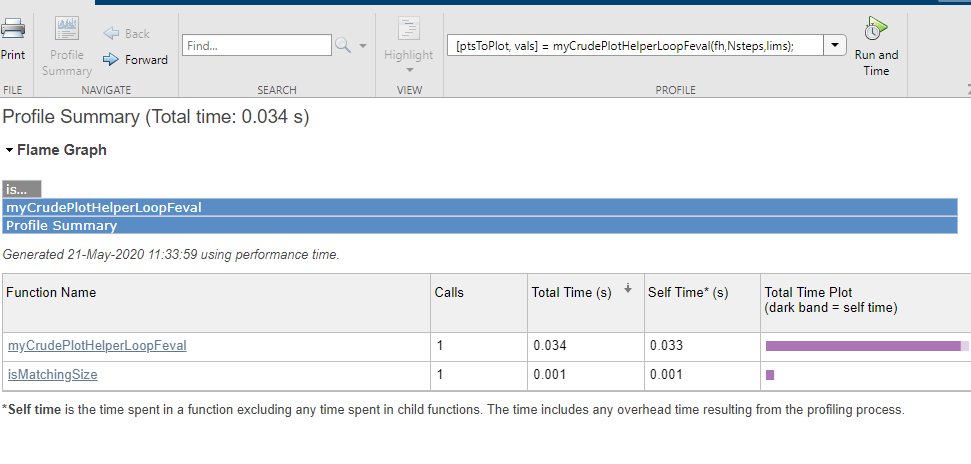
It took 0.034 seconds. Otherwise, this is not so useful yet, so I click on the name of my function in the flame graph at the top to see what happened in my file.
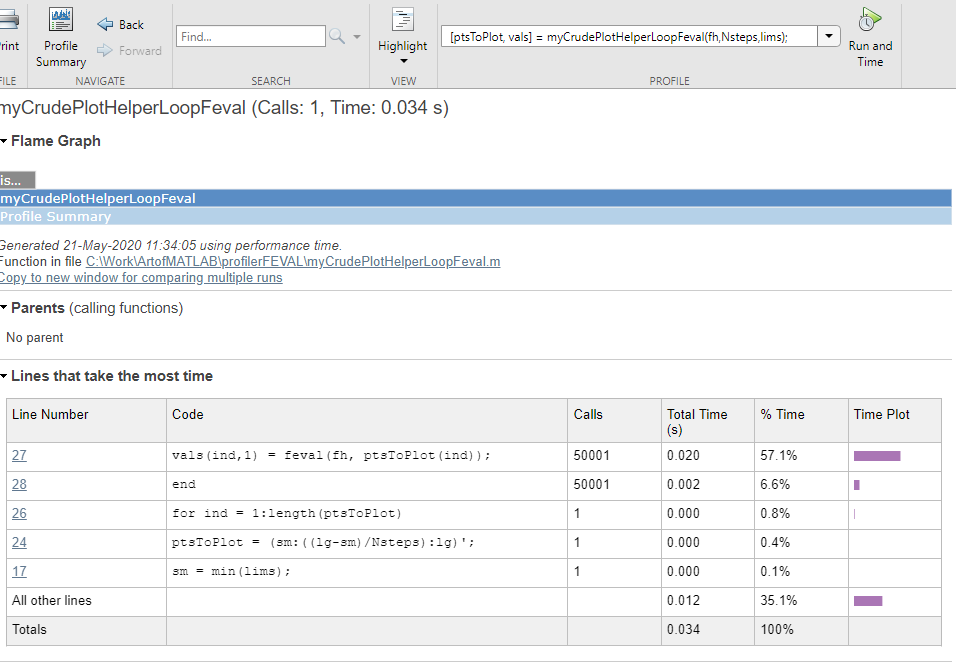
It shows me that I am calling line 27, with feval, many times. Scrolling down further, I get some more information from the Code Analyzer results.
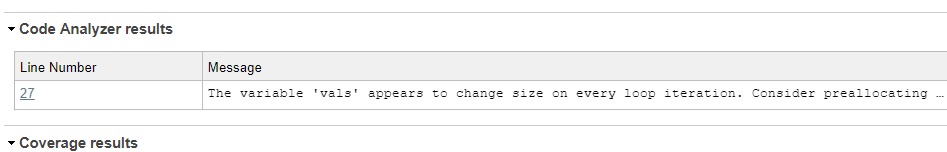
It notices that I did not preallocate the output vector, although it seems I should know the size.
Aside: notice the use of the arguments block for error checking.
Code - Attempt 2
Next we'll see what happens when I preallocate the vector for the output.
function [ptsToPlot, vals] = ...
    myCrudePlotHelperPreAllocLoopFeval(fh,Nsteps,lims)
% Crude helper function to prepare function values for plotting
%
% Example:
%  fh = @(x)sqrt(abs(sin(x.^2+17)));
%  [ptsToPlot, vals] = myCrudePlotHelperLoopFeval(fh,50000,[0, pi]);
%  plot(ptsToPlot, vals)
%

arguments
    fh (1,1) function_handle;
    Nsteps (1,1) double = 100000;
    lims (1,2) double = [-pi, pi];
end


sm = min(lims);
lg = max(lims);
% Nsteps+1 = number of points to create.  1/N helps determine the stepsize.
% 100000 is far more points than we need, but I want to do a bunch of
% meaningful computation so we get a reasonable reading.

% Get x-axis for points to plot.
ptsToPlot = (sm:((lg-sm)/Nsteps):lg)';
% Compute output using feval in a loop.
vals = zeros(size(ptsToPlot));
for ind = 1:length(ptsToPlot)
    vals(ind,1) = feval(fh, ptsToPlot(ind));
end
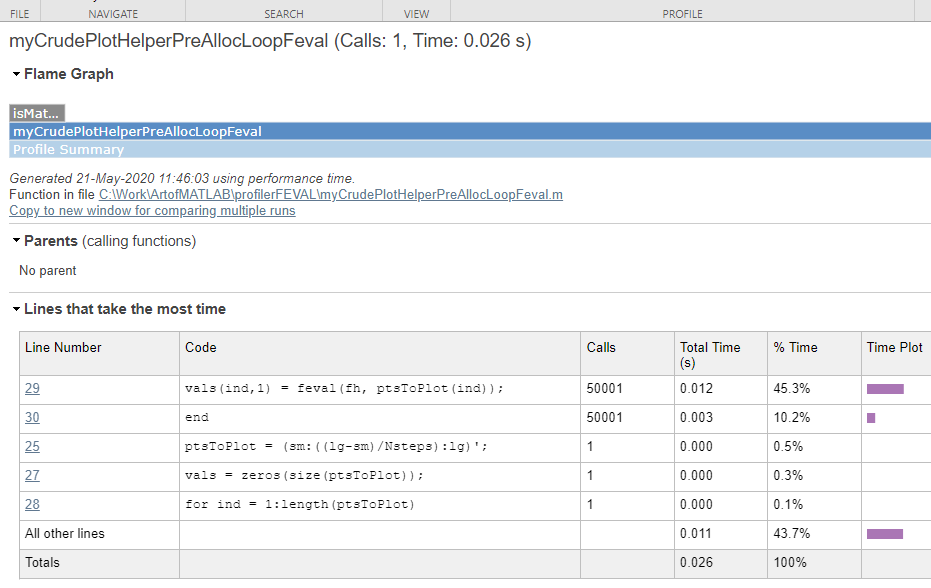
Time is down to 0.026 seconds.
Code - Attempt 3
Next I want to lose the loop altogether and see what happens.
function [ptsToPlot, vals] = myCrudePlotHelperFeval(fh,Nsteps,lims)
% Crude helper function to prepare function values for plotting
%
%
% Example:
%  fh = @(x)sqrt(abs(sin(x.^2+17)));
%  [ptsToPlot, vals] = myCrudePlotHelperLoopFeval(fh,50000,[0, pi]);
%  plot(ptsToPlot, vals)
%

arguments
    fh (1,1) function_handle;
    Nsteps (1,1) double = 100000;
    lims (1,2) double = [-pi, pi];
end

%

% Check input arguments - should be 1 or 2.  Second should be real-valued
% 2-element vector.
if nargin < 1
    error("Not enough input arguments.")
elseif nargin == 1
    lims = [-pi, pi];
else
    if length(lims) ~= 2 || ~isreal(lims)
        error("The second input must be a 2-element real vector.")
    end
end

sm = min(lims);
lg = max(lims);
% N+1 = number of points to create.  1/N helps determine the stepsize.
% 100000 is far more points than we need, but I want to do a bunch of
% meaningful computation so we get a reasonable reading.
N = 100000;
% Get x-axis for points to plot.
ptsToPlot = (sm:((lg-sm)/N):lg)';
% doing a vectorized feval, and a vectorized evaluation without feval.
vals = feval(fh, ptsToPlot);
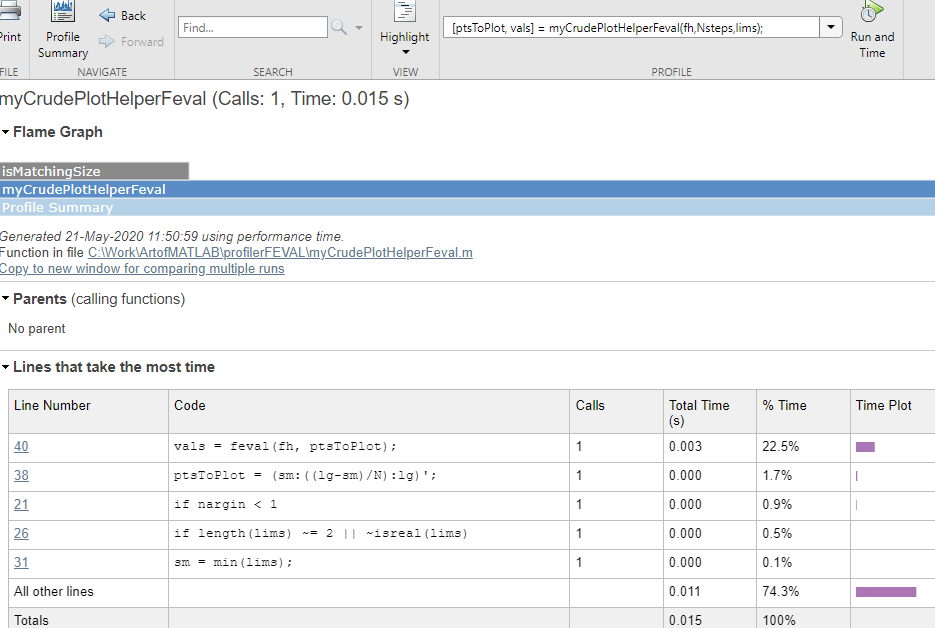
Time is down to 0.015 seconds. It pays to call our function once instead of Nsteps times!
Code - Attempt 4
And now I am going to remove the call to feval completely as it hasn't been necessary for calling function handles in a very long time.
function [ptsToPlot, vals] = myCrudePlotHelperNoFeval(fh,Nsteps,lims)
% Crude helper function to prepare function values for plotting
%
% Example:
%  fh = @(x)sqrt(abs(sin(x.^2+17)));
%  [ptsToPlot, vals] = myCrudePlotHelperLoopFeval(fh,50000,[0, pi]);
%  plot(ptsToPlot, vals)
%

arguments
    fh (1,1) function_handle;
    Nsteps (1,1) double = 100000;
    lims (1,2) double = [-pi, pi];
end

sm = min(lims);
lg = max(lims);
% Nsteps+1 = number of points to create.  1/N helps determine the stepsize.
% 100000 is far more points than we need, but I want to do a bunch of
% meaningful computation so we get a reasonable reading.

% Get x-axis for points to plot.
ptsToPlot = (sm:((lg-sm)/Nsteps):lg)';
% Compute vectorized evaluation without feval.
vals = fh(ptsToPlot);
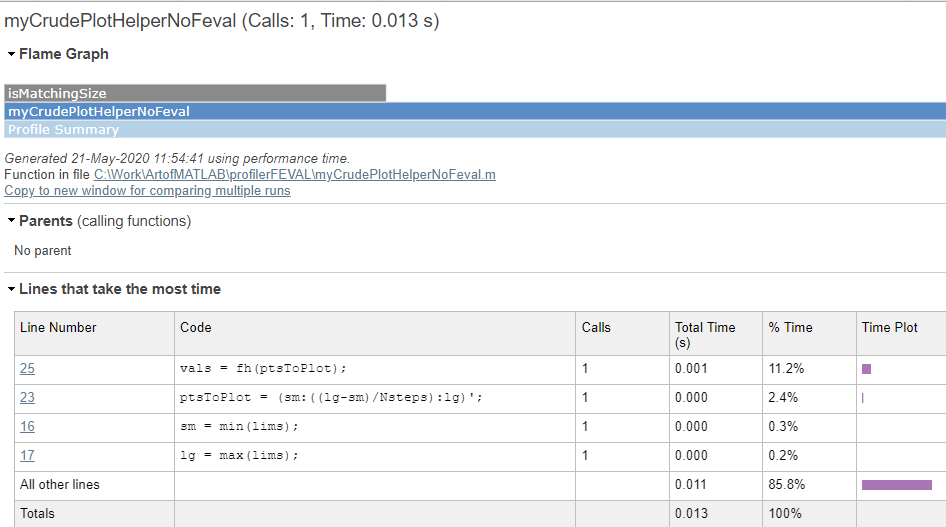
We reduced the time to 0.013s now - not dramatic compared to the other version with preallocation. But MUCH improved over the earlier ones.
Discussion
The reason I care about the overhead for feval is there are times when we are doing some calculation that is adaptive or iterative. In that case, we don't have the luxury of making all of our calculations in a single call. So I am trying to squeeze out as much performance from the basic calculation so extra unnecessary stuff has no chance to dominate.
Here's my final comparison, with a preallocated variable in a loop, without feval.
function [ptsToPlot, vals] = ...
    myCrudePlotHelperPreAllocLoopFeval(fh,Nsteps,lims)
% Crude helper function to prepare function values for plotting
%
% Example:
%  fh = @(x)sqrt(abs(sin(x.^2+17)));
%  [ptsToPlot, vals] = myCrudePlotHelperLoopFeval(fh,50000,[0, pi]);
%  plot(ptsToPlot, vals)
%

arguments
    fh (1,1) function_handle;
    Nsteps (1,1) double = 100000;
    lims (1,2) double = [-pi, pi];
end


sm = min(lims);
lg = max(lims);
% Nsteps+1 = number of points to create.  1/N helps determine the stepsize.
% 100000 is far more points than we need, but I want to do a bunch of
% meaningful computation so we get a reasonable reading.

% Get x-axis for points to plot.
ptsToPlot = (sm:((lg-sm)/Nsteps):lg)';
% Compute output using feval in a loop.
vals = zeros(size(ptsToPlot));
for ind = 1:length(ptsToPlot)
    vals(ind,1) = fh(ptsToPlot(ind));
end

Time is in the middle, 0.024 seconds
So lots of gain from vectorization, but some gain, possibly worthwhile, for removing the overhead of feval.
Could this make a difference in some computational bottlenecks in your code? Let us know here.
- Category:
- Best Practice,
- Coding Style,
- Performance


See Also
-

Downsampling polygons
Blogs
-

Box plot + Scatter plot
Blogs
-

Mental Model for feval
Blogs


Comments
To leave a comment, please click here to sign in to your MathWorks Account or create a new one.