
Having an Argument in Release R2021a
Have you ever looked at code where you are calling a function with many arguments, many of which are strings, and find it hard to see what's going on? I know I have. And perhaps you too. In release R2021a, there is a new feature in the language that can help me out, in addition to the relatively new arguments block which I wrote about here. For making your own argument, you might want to watch this classic video.
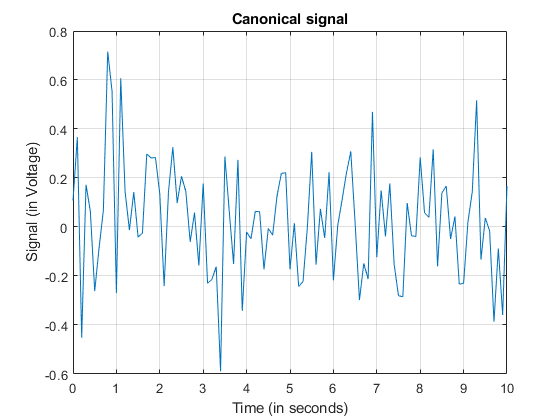
Make a plot to modify
Let's start by making a plot and annotating it.
t = 0:0.1:10;
y = sin(2*pi*60*t) + 0.2*randn(size(t));
plot(t,y)
xlabel("Time (in seconds)")
ylabel("Signal (in Voltage)")
title("Canonical signal")
grid("on")
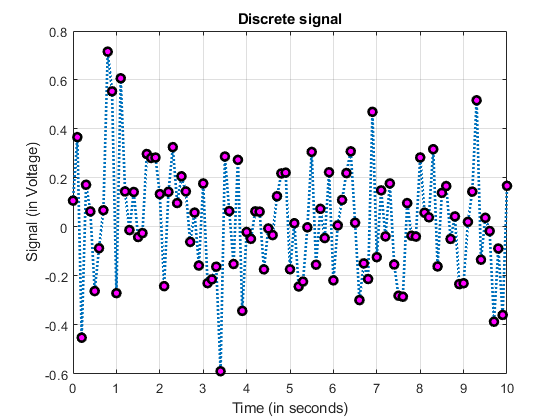
Change the plot via name-value pairs (2020 and before)
Now let's say I want to recreate the same plot but with more control over the appearance. I could use name-value pairs, which we've been using in MATLAB for years.
plot(t,y,"Marker","o","MarkerEdgeColor","k","MarkerFaceColor","y","LineStyle","-.","LineWidth",1.0)
xlabel("Time (in seconds)")
ylabel("Signal (in Voltage)")
title("Discrete signal")
grid("on")

As you read your way through that first line to plot right above, it's easy to get lost, especially if the values happen to be longer strings.
Change the plot via name=value (starting in R2021a)
I could use the new feature in R2021a to use name=value syntax (as well as here) to accomplish the same result.
plot(t,y,Marker="o",MarkerEdgeColor="k",MarkerFaceColor="m",LineStyle=":",LineWidth=2.0)
xlabel("Time (in seconds)")
ylabel("Signal (in Voltage)")
title("Discrete signal")
grid("on")
Smooth the data
Now let's try smoothing that signal and display the results.
smoothedData = smoothdata(y,"movmean",SmoothingFactor=0.5,SamplePoints=t);
plot(t,y,"Color",[77 190 238]/255,DisplayName="Input data")
hold on
plot(t,smoothedData,Color=[0 114 189]/255,LineWidth=1.5,...
DisplayName="Smoothed data")
hold off
legend
xlabel("Time (in seconds)")
ylabel("Signal (in Voltage)")
title("Smoothed signal")
grid("on")

Discussion
This syntax has some restrictions, listed in the release notes. E.g., the name=value syntax is only valid for trailing in inputs. In other words, once you opt in to the syntax for a given function call, all the remaining inputs must also be in name=value form. Since the syntax is new, there are also some affordances missing for the moment, like tab-completion. From my perspective, I think it makes my code even more self-documenting than before, since the burden of matching with string inputs is no longer an issue. What are your thoughts on name=value syntax for optional, trailing input arguments? Let us know here.
Copyright 2021 The MathWorks, Inc.
- Category:
- Language,
- New Feature


Comments
To leave a comment, please click here to sign in to your MathWorks Account or create a new one.