 Cleve’s Corner: Cleve Moler on Mathematics and Computing
 The MATLAB Blog
 Guy on Simulink
 MATLAB Community
 Artificial Intelligence
 Developer Zone
 Stuart’s MATLAB Videos
 Behind the Headlines
 File Exchange Pick of the Week
 Hans on IoT
 Student Lounge
 MATLAB ユーザーコミュニティー
 Startups, Accelerators, & Entrepreneurs
 Autonomous Systems
 Quantitative Finance
 MATLAB Graphics and App Building
Subplot Position Calculator
Jiro‘s pick this week is Subplot Position Calculator by Christopher Hummersone.
subplot is a nice way to place a grid of axes on a single figure. But the spacing is sometimes a bit too generous, leaving too little room for the graph.
nRows = 3;
nCols = 2;
for m = 1:nRows
    for n = 1:nCols
        subplot(nRows,nCols,(m-1)*nCols+n)
        plot(rand(20,1))
    end
end

In that case, you can use axes or subplot to specify the actual placement of the axes.
figure
subplot('position',[0.05 0.1 0.45 0.8])
plot(rand(20,1))
subplot('position',[0.55 0.1 0.4 0.8])
plot(rand(20,1))

But this defeats the purpose of subplot because you have to calculate and specify the position manually. This is where Christopher’s entry comes in handy. It lets you specify the grid layout, with optional parameters, and it returns a set of position vectors which you can feed into subplot or axes.
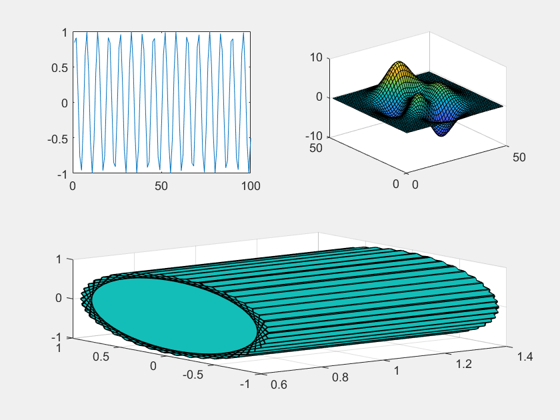
The default is a tight layout with no margin.
pos = iosr.figures.subfigrid(nRows,nCols);
figure
for m = 1:nRows
    for n = 1:nCols
        subplot('Position',pos(m,:,n))
        plot(rand(20,1))
    end
end

You can specify the spacing and the scaling by passing in a couple of optional arguments.
pos = iosr.figures.subfigrid(nRows,nCols,[0.1 0.05 0.05 0.1],[.95 .95]);
figure
for m = 1:nRows
    for n = 1:nCols
        subplot('Position',pos(m,:,n))
        plot(rand(20,1))
    end
end

As some of you may have guessed, his function is part of a package (IoSR Matlab Toolbox), and the other functionalities are also highlighted in his other File Exchange entries.
In addition to the usefulness of this function, I like Christopher’s entry because it is well-written with plenty of error-checking and has good help with examples. I haven’t had a chance to check out his other functions in his toolbox, but I would expect the same kind of quality as seen in this one.
Comments
Give it a try and let us know what you think here or leave a comment for Christopher.
- 범주:
- Picks


댓글
댓글을 남기려면 링크 를 클릭하여 MathWorks 계정에 로그인하거나 계정을 새로 만드십시오.