
Contour Data
Sean‘s pick this week is contourdata by Duane Hanselman.
Last week I was asked a simple question from a customer: “How do I export a contour plot to Google Earth?”
I knew that this should be possible for either contour line plots or filled plots since the Mapping Toolbox has functions for writing the needed plot primitives, i.e: lines (kmlwriteline), polygons (kmlwritepolygon), and points (kmlwritepoint).
So how to do it? I knew about the contourc function but had never used it. In theory, this would give me the contour lines that I could then write to Google Earth with the kml* functions.
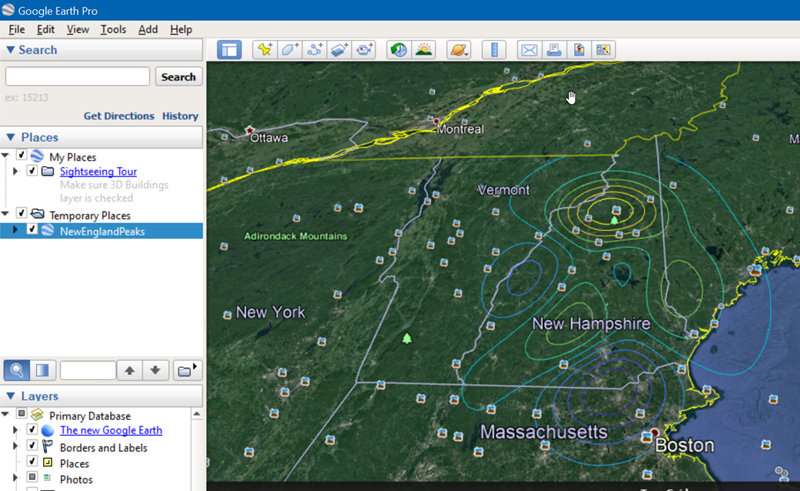
For this example, I’ll use peaks, and plot them roughly over New England.
z = peaks(50);
lon = linspace(-73, -70, 50);
lat = linspace(42, 45, 50);
nlevels = 10;
c = contourc(lon, lat, z, nlevels);
Okay, so what is c?
whos('c')
  Name      Size             Bytes  Class     Attributes

  c         2x817            13072  double
Huh?
To the documentation I go. The doc for contourc pointed to the ContourMatrix property of a contour plot. The rows of the matrix are x and y preceded by the contour level and number of points. Contourc very quickly became one of my not favorite functions. Ughh. I generally try to avoid structures and prefer tables but this is an ideal use for an array of structures. It has some meta information: level, number of points, and whether it’s a closed contour or not, and some data that could be various sizes so you can’t use a table.
Am I really going to have to write a while-loop to parse this thing?
No! Professor Hanselman has a function that does exactly what I want.
cs = contourdata(c);
disp(cs)
  1×16 struct array with fields:
    level
    numel
    xdata
    ydata
    isopen
Perfect.
So to finish off the example what else did I have to do?
kmlwrite would be the easiest way to write everything in one shot. It accepts a geoshape. I need to have the string literals “Lat”, “Lon”, “Latitude” or “Longitude” as fields of a struct to pass in.
[cs.Lat] = cs.ydata;
[cs.Lon] = cs.xdata;
cs = rmfield(cs, {'xdata', 'ydata'});
g = geoshape(cs);
Geoshapes can be written directly with kmlwrite. However, I need to tell kmlwrite which color to use for each line. The level value is stored as a feature property in the geoshape passed in from the struct. We can get the corresponding color using the index into the unique levels which are sorted be default.
[~, ~, levidx] = unique(g.level);
cmap = parula(nlevels);
Finally, write the kml file. In order to guarantee that the levels can be seen, clamp them to the ground.
kmlwrite('NewEnglandPeaks.kml', g, 'Color', cmap(levidx, :), 'AltitudeMode', 'clampToGround')
Warning: Omitting unsupported data
class: logical
Comments
Give it a try and let us know what you think here or leave a comment for Prof. Hanselman.
Published with MATLAB® R2017b
- Category:
- Picks


Comments
To leave a comment, please click here to sign in to your MathWorks Account or create a new one.