My First Debugging Steps
Seth sometimes tells me: Grab the low hanging fruit. When debugging Simulink models, this means looking at the information easily available.
Here are the first three things I usually look at when I see unexpected results in a model.
Signal Dimensions
When dealing with matrices and vectors, I like to enable Port/Signal Displays of Signal Dimensions and Wide Nonscalar Lines

With those options enabled, I can easily identify that the following state-space system has 2 inputs, 3 outputs and 4 states.

Data Types
In Simulink, you do not need to specify the data type of each signal. In most cases, you specify the data types of a few sources and the Simulink engine propagates it to other blocks. When a model gives unexpected results, it is always a good idea to display the Port Data Types

For example, how could someone explain that Simulink thinks that 5 is equal to 1? Take a look at this model:

Sample Time Colors and Legend
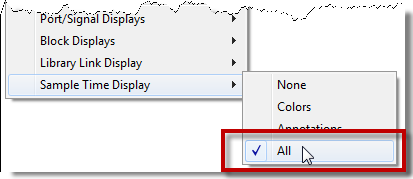
You always want to confirm that your signals are at the rate you expect. For that, turn on the Sample Time Colors and look at the Sample Time Legend:

I have seen too many cases like the following model, where the user designs a position controller to run at 4ms, but forgot to set the sample time of the driver block reading the position of the motor:

Now it's your turn
What are the things you usually look at when debugging a model? Leave a comment here.


评论
要发表评论,请点击 此处 登录到您的 MathWorks 帐户或创建一个新帐户。