Comparing Runs using Simulation Data Inspector
Do you use the Simulation Data Inspector? Here is an example where it saved me a lot of debugging time.
Simulation Accuracy
I recently had to validate system behavior and analyze numerical accuracy of a model. Making small modifications in one part of the model was leading to unexpectedly large differences at the outputs. Since the model was very large, I thought it would be painful to insert Scopes or To Workspace blocks in the model to try identifying the source of the problem.
I found out that the Simulation Data Inspector can be very useful to compare simulation results without adding blocks to your model and without writing any scripts. Let's see how this work!
Logging Signals
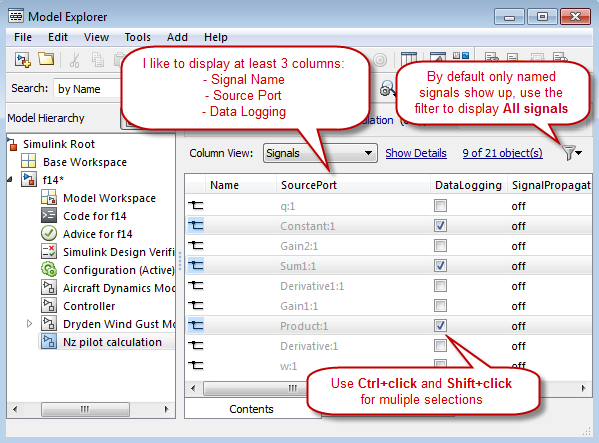
The first step is to configure signals for logging. I like to use the Model Explorer for that. It is significantly faster than right-clicking on the signal lines one by one. Here are a few tips to configure the Model Explorer with the goal of controlling signal logging.

Also, ensure that signal logging is enabled in the model configuration.

Record & Inspect Simulation Output
In your model, click on the Record button.

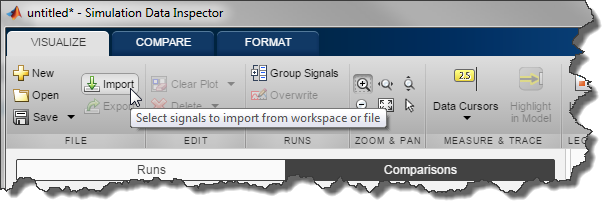
When the simulation is completed, open the Simulation Data Inspector using the link that pops up.

Compare Runs
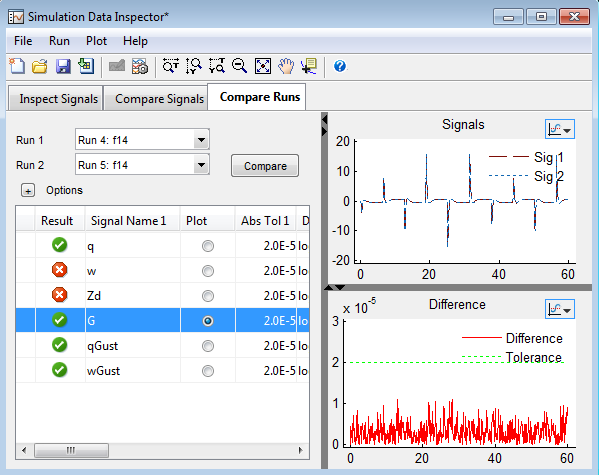
Make some changes to your model and simulate it again. In the Simulation Data Inspector, go to the Compare Runs Tab, select your 2 runs and click Compare.
Using the absolute tolerance I specified, the Simulation data Inspector helped me to quickly identify where the divergence appear in my model.

Now it's your turn
Give a look and the Validate System Behavior section of the documentation to learn more about the Simulation Data Inspector and let us know if it helps your workflow by leaving a comment here.


コメント
コメントを残すには、ここ をクリックして MathWorks アカウントにサインインするか新しい MathWorks アカウントを作成します。