
How do you Inspect Logged Signals?
I receive and debug Simulink models all day every day. This means that I often need to log many signals and inspect them to understand what the model is doing.
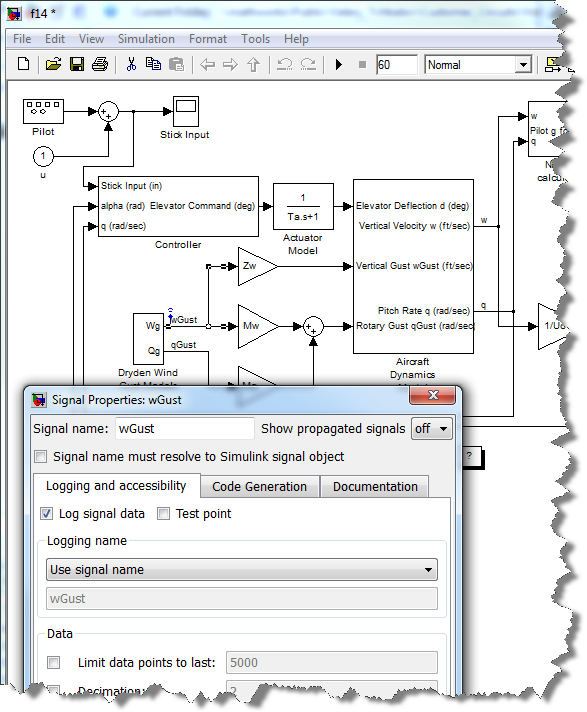
For that, I like using the Simulation Data Inspector Browse Mode in combination with the in-canvas logging badges. I decided to share that today because this is not the default behavior, and I don't want you to miss it.
Here is what it looks like. Simply clicking the logging badge controls the signal displayed in the Simulation Data Inspector. That way you can quickly follow the flow of data in the canvas and determine at which point something unexpected happens.
How to Enable Browse Mode
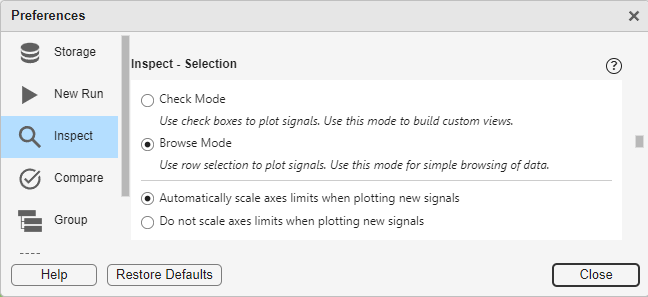
In the Simulation Data Inspector preferences, go to the Inspect - Selection section to select between Check Mode and Browse Mode
Check Mode versus Browse Mode
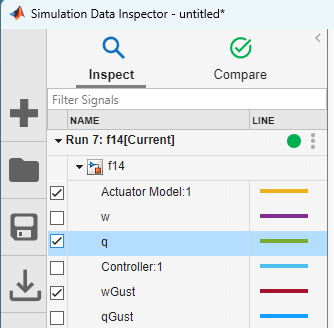
I like to use Check Mode when I want to create a persistent reusable view, save it and share it. In that case, a check box is displayed next to each signal, and you need to click it to display the signal, and click it again to remove it.
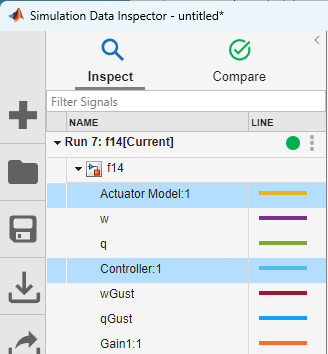
When I am in an exploration or debugging workflow and I don't really know which signal I will want to look at in advance, I like to use Browse Mode. In that mode, the check boxes are gone and clicking on a signal replaces the signal displayed. To display multiple signals on the same plot, you can use the Shift key to multi-select.
Now it's your turn
Are you leveraging those two modes when visualizing logged data? Let us know in the comments below.
- カテゴリ:
- Signals,
- Simulink Tips


See Also
-

Logging Multiple Signals
Blogs
-
-
-
コメント
コメントを残すには、ここ をクリックして MathWorks アカウントにサインインするか新しい MathWorks アカウントを作成します。