
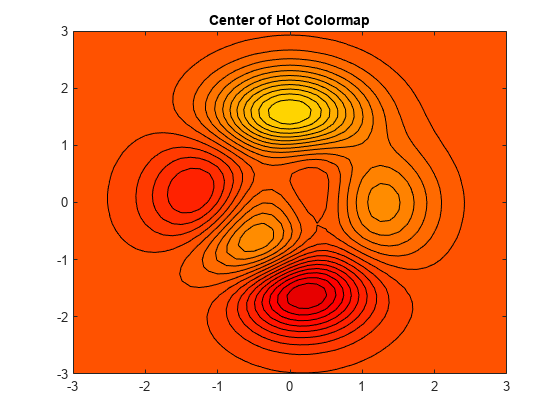
Advanced: Modifying a contour plot with Handle Graphics
The contour plot will choose the colors of the contour lines based on the level of the contour. However, if you want to do something more, like change the line width or line style, you will need to do something like what follows in the video.


コメント
コメントを残すには、ここ をクリックして MathWorks アカウントにサインインするか新しい MathWorks アカウントを作成します。