Well, am I turning red! Soon after I posted my last video about how to find the volume underneath a set of non uniformly spaced data, I found one of our developers had a better way to do it using… 続きを読む >>

Well, am I turning red! Soon after I posted my last video about how to find the volume underneath a set of non uniformly spaced data, I found one of our developers had a better way to do it using… 続きを読む >>

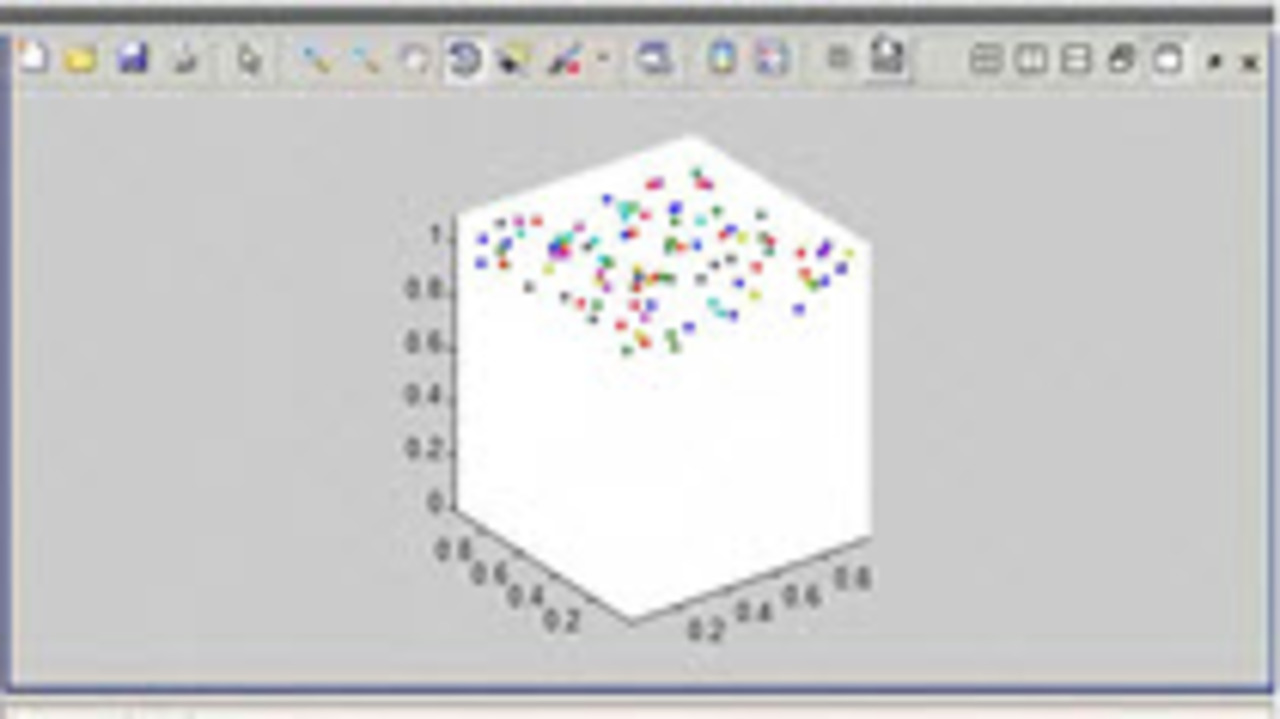
This video covers the use of GRIDDATA, anonymous functions, and QUAD2D to integrate the volume under a set of randomly spaced data points. First an interpolation scheme must be put in place, then a… 続きを読む >>
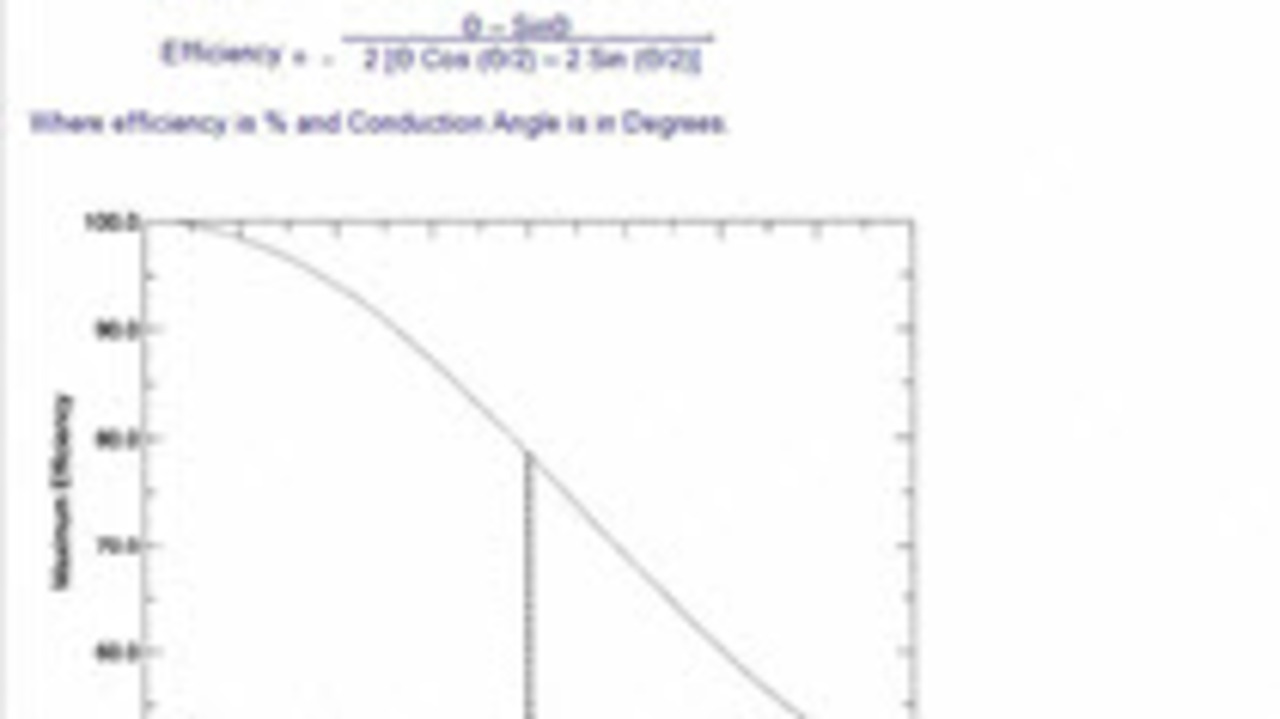
This video will demonstrate how to implement a formula in MATLAB. In the video, we will make a function out of the formula. The function will take a scalar (single number) or a vector. We want to… 続きを読む >>
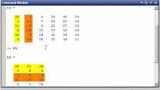
This short video covers the thought process of rewriting some code for clarity. The six lines of code are lengthened into twice that. The code is much more readable and maintainable. The problem… 続きを読む >>
The “Rules of the new game” puzzler was the most difficult one yet. Puzzlers are MATLAB programming challenges that I post from time to time. They lead to interesting discussions of… 続きを読む >>
I was once one of the many people that have been a steward of the Pick Of The Week blog. I try not to highlight File Exchange files here, but this exceptional tutorial is, well, an… 続きを読む >>
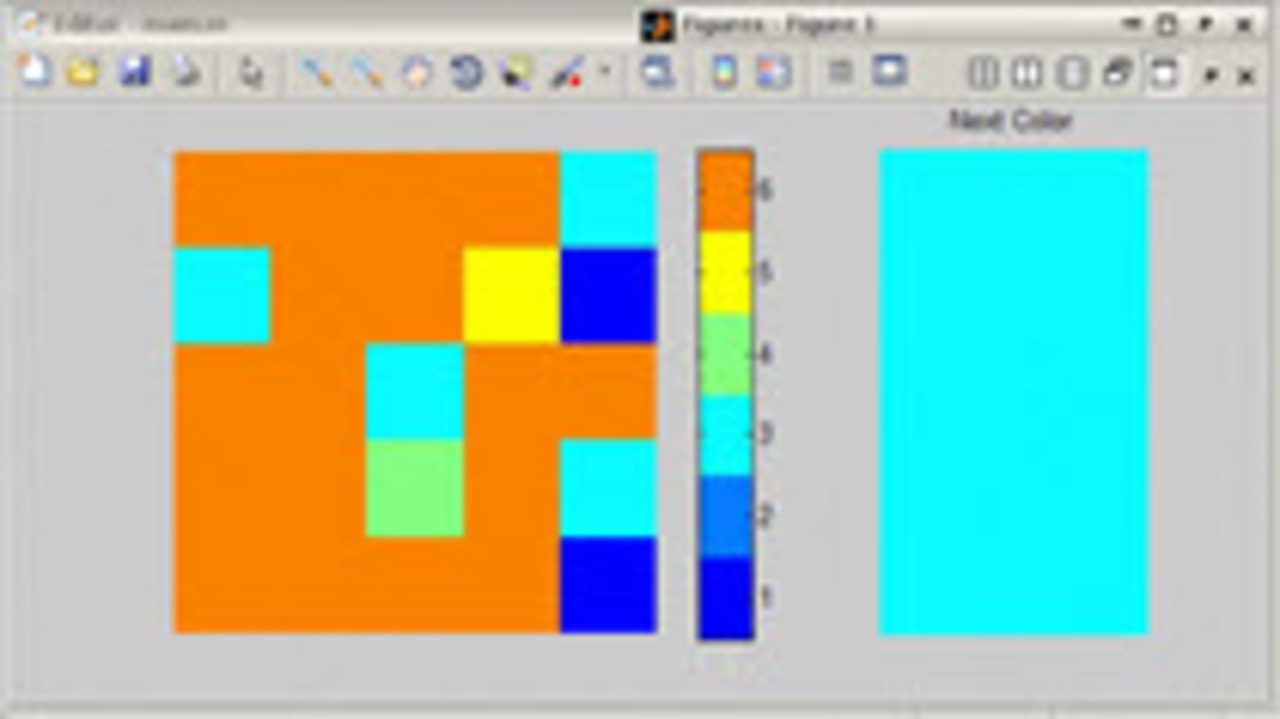
I was playing a game by LabPixies on my iPhone. I spent more time thinking about programming an optimal solution than anything else while playing. I decided to give it a try in MATLAB. After… 続きを読む >>
I frequent Twitter as MATLABDoug. You can check there for daily MATLAB tips in 140 characters or less, blog post announcements and other things that I find interesting. While reading the… 続きを読む >>
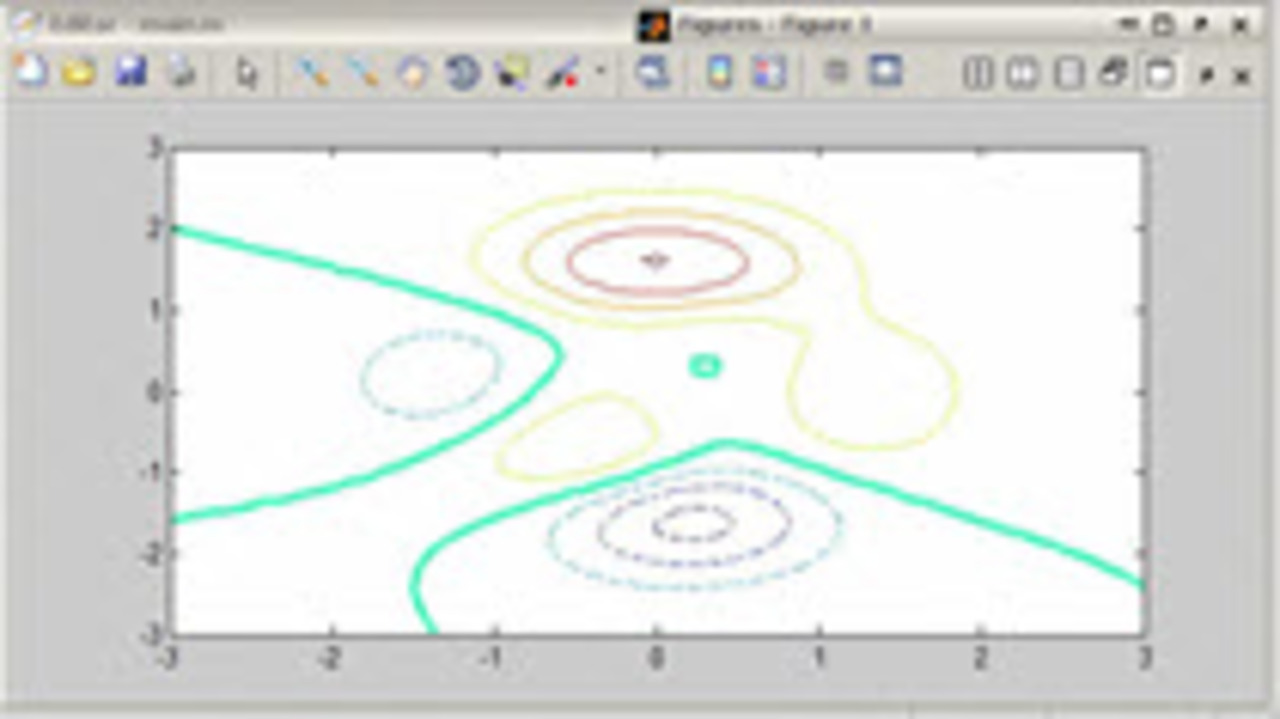
The contour plot will choose the colors of the contour lines based on the level of the contour. However, if you want to do something more, like change the line width or line style, you will need to… 続きを読む >>
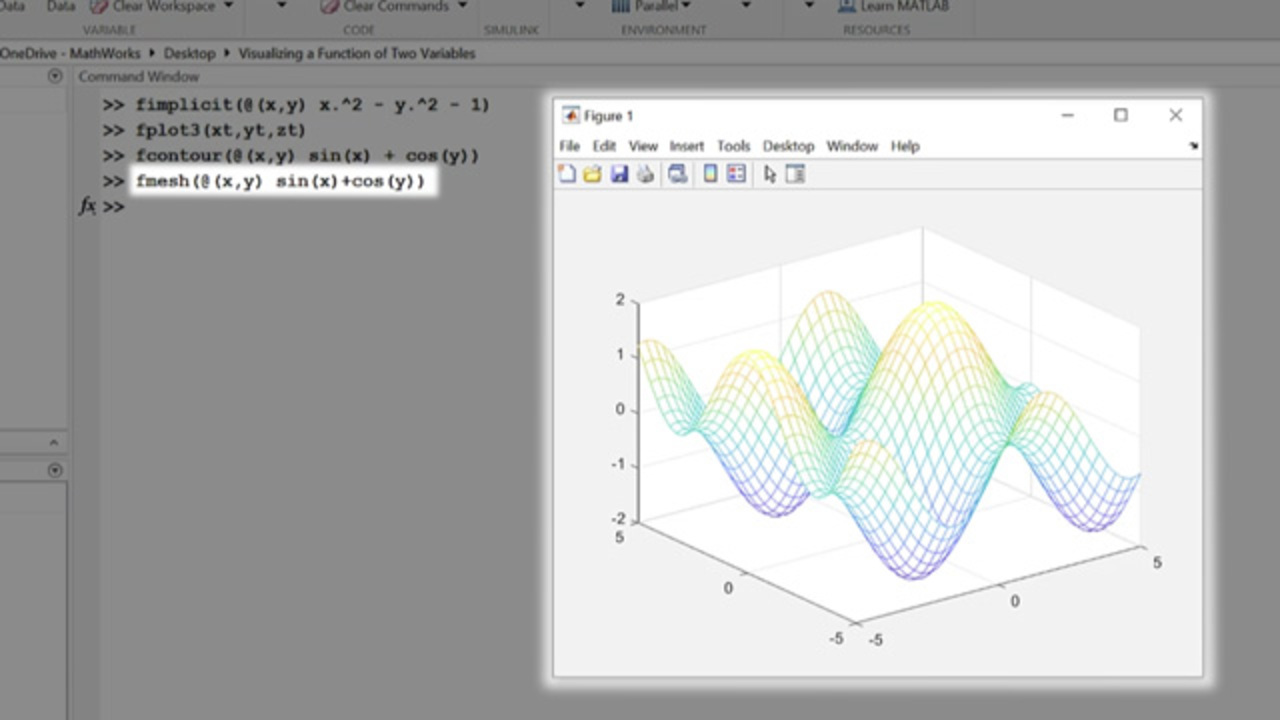
I was interested in visualizing isolines on a graph of BMI. This is a non-linear function of two variables. I thought the best way to visualize this would be with a contour plot. This video… 続きを読む >>