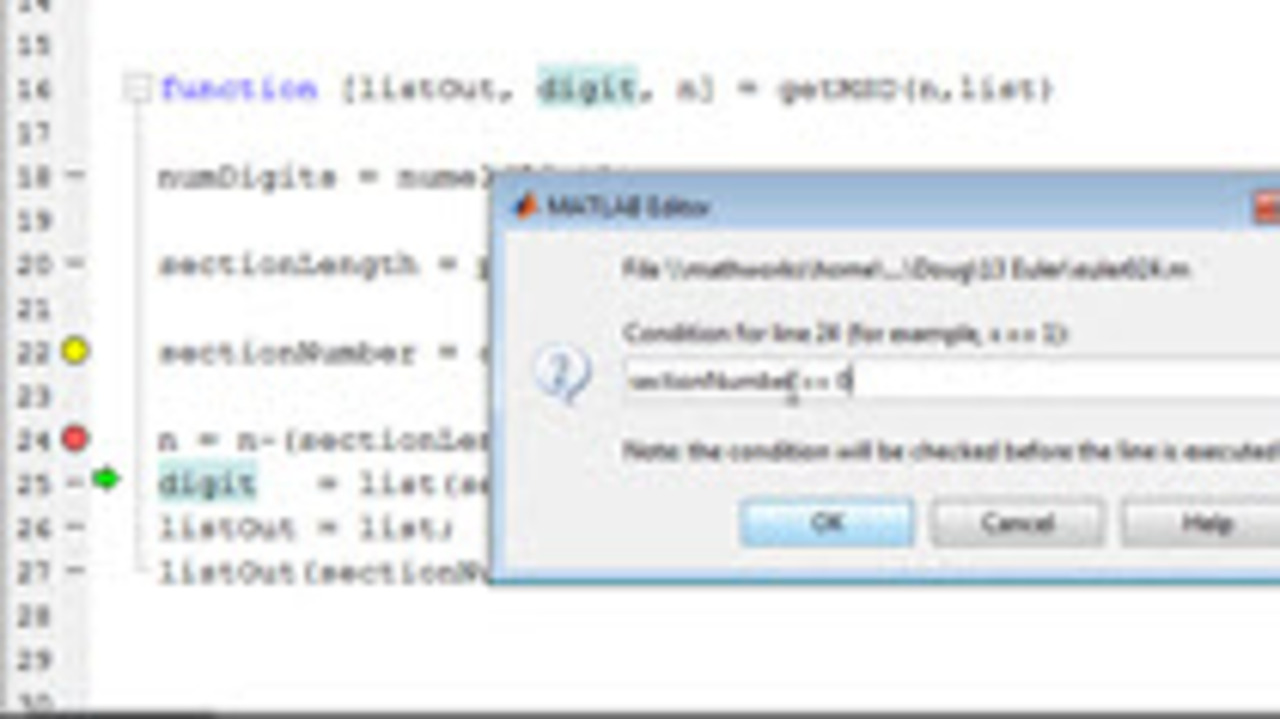
Sometimes MATLAB throws an error, but because the error is inside of a function you can not see what caused this error. By telling the debugger to stop execution under certain conditions or right… 更多内容 >>

Sometimes MATLAB throws an error, but because the error is inside of a function you can not see what caused this error. By telling the debugger to stop execution under certain conditions or right… 更多内容 >>
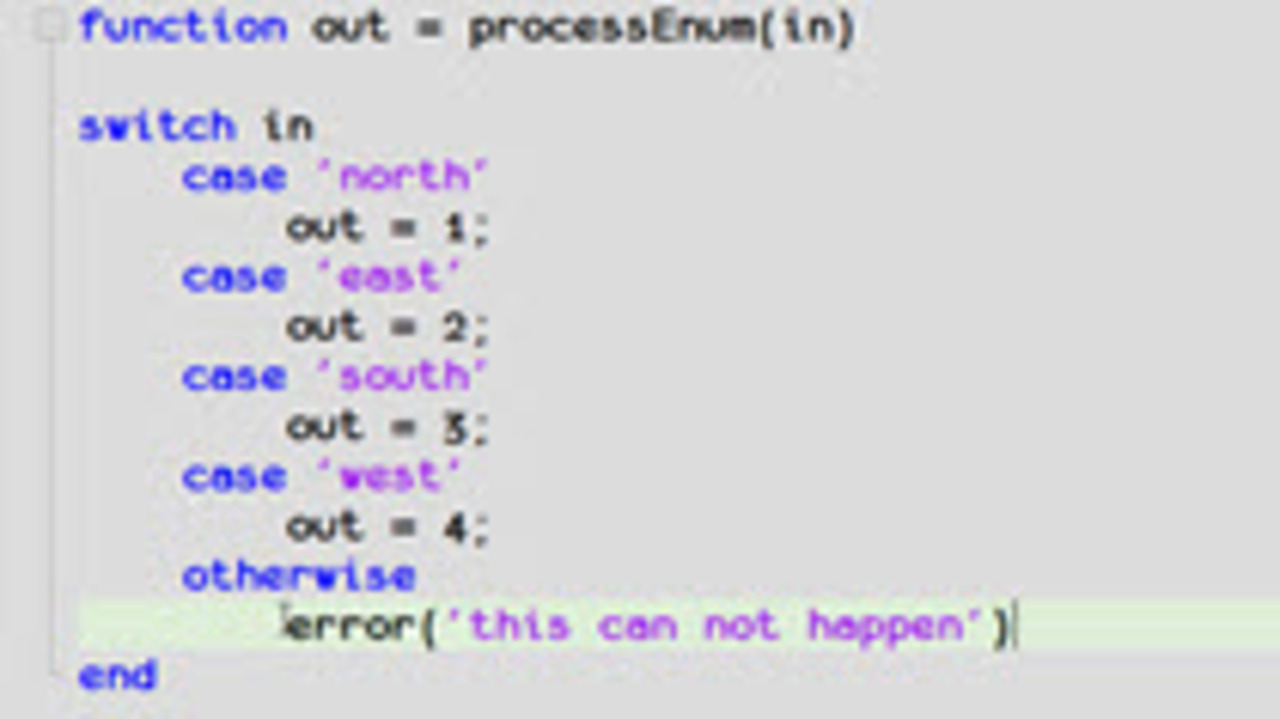
In some code there is an enumerated set of choices. People will use a switch case statement to check for all but one choice and then catch that last one in the ‘otherwise’ block of their… 更多内容 >>
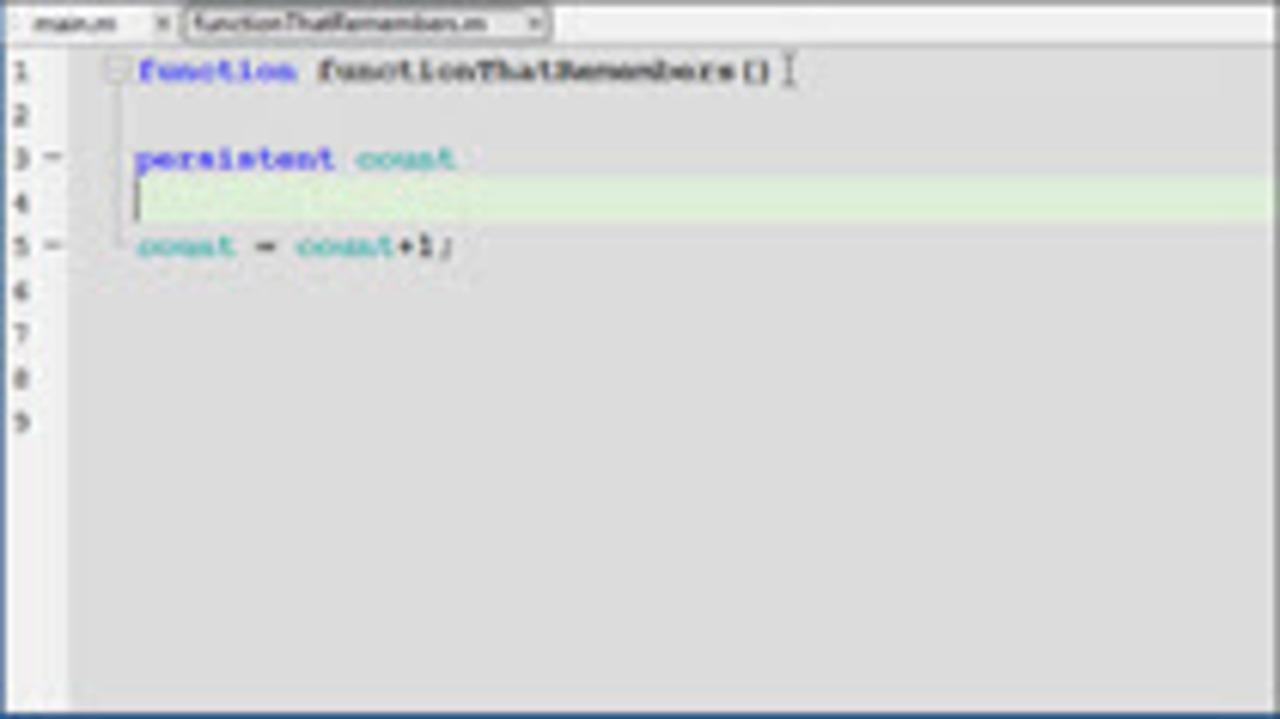
There are situations where you want MATLAB to remember the value of a variable from one call of a function to another call of that function. We show to use a persistent value to accomplish this. … 更多内容 >>
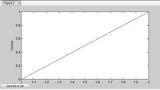
There are often small tweaks to functionality that you would like for a figure in MATLAB. This video shows how to add a button to a figure that will allow you to toggle the units of a y axes between… 更多内容 >>

A colleague was trying to draw some structures and do basic static analysis on them. He wanted to write a routine that would draw a pinned beam given the locations of the two pins. This can be done… 更多内容 >>
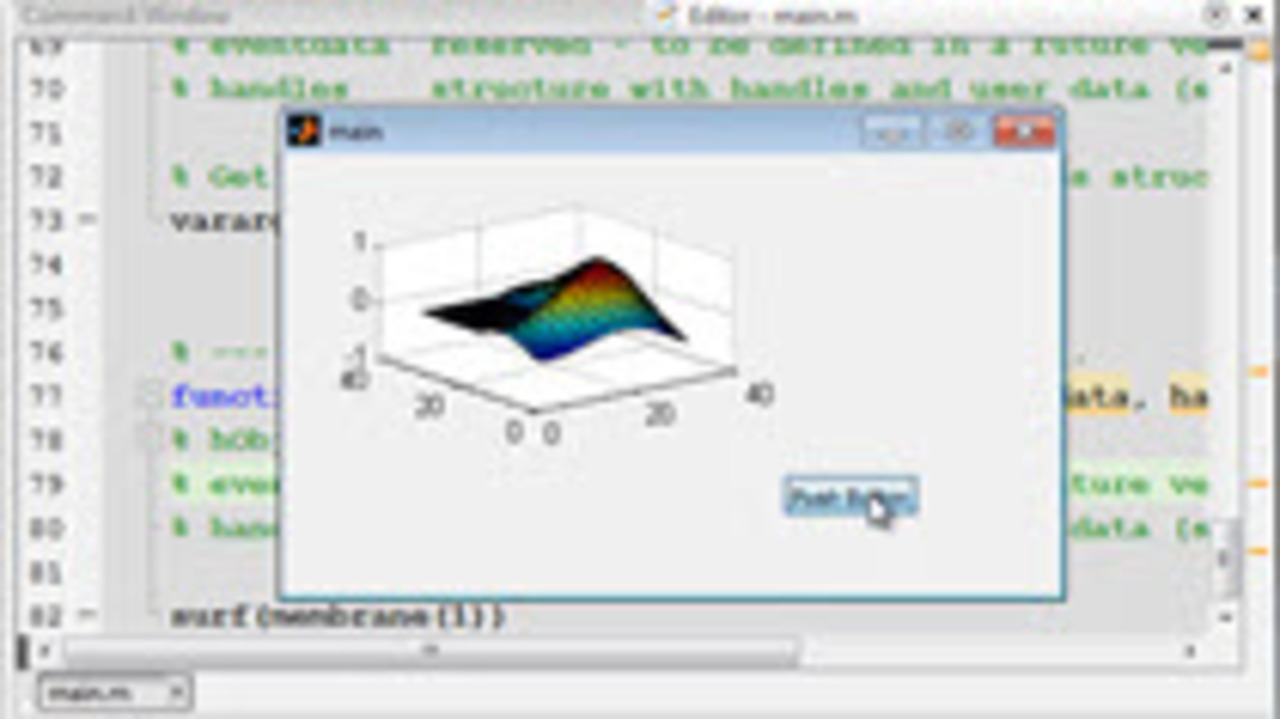
This post is a continuation of the last video where we built a simple GUI in MATLAB. This continues by showing how to run initiation code for a MATLAB GUI and explains what the handles structure… 更多内容 >>
As we approach video number three hundred on this blog, I thought it was time to remake the original video that got this all started. I still refer people to it on a weekly basis. This shows you… 更多内容 >>
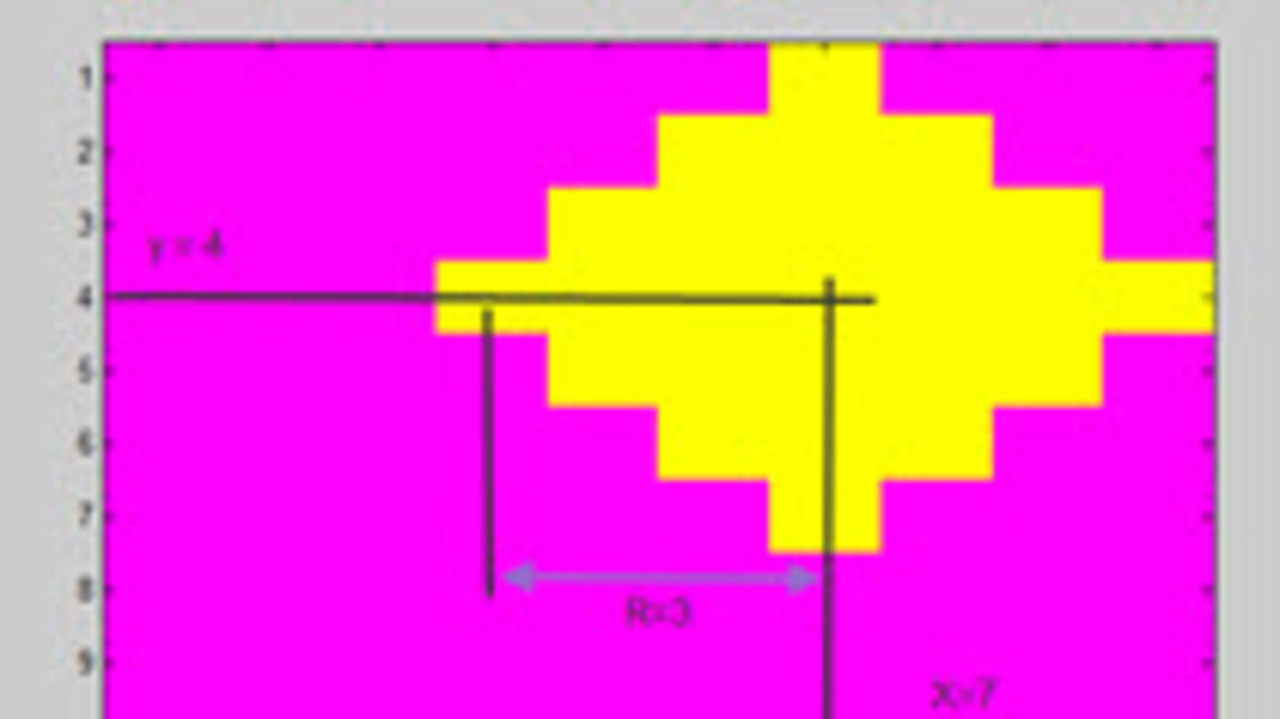
I got a quick question today on how to make a diamond appear on an image in MATLAB. This is really an exercise in indexing and for loops in MATLAB. Let’s see how you can make an image in… 更多内容 >>
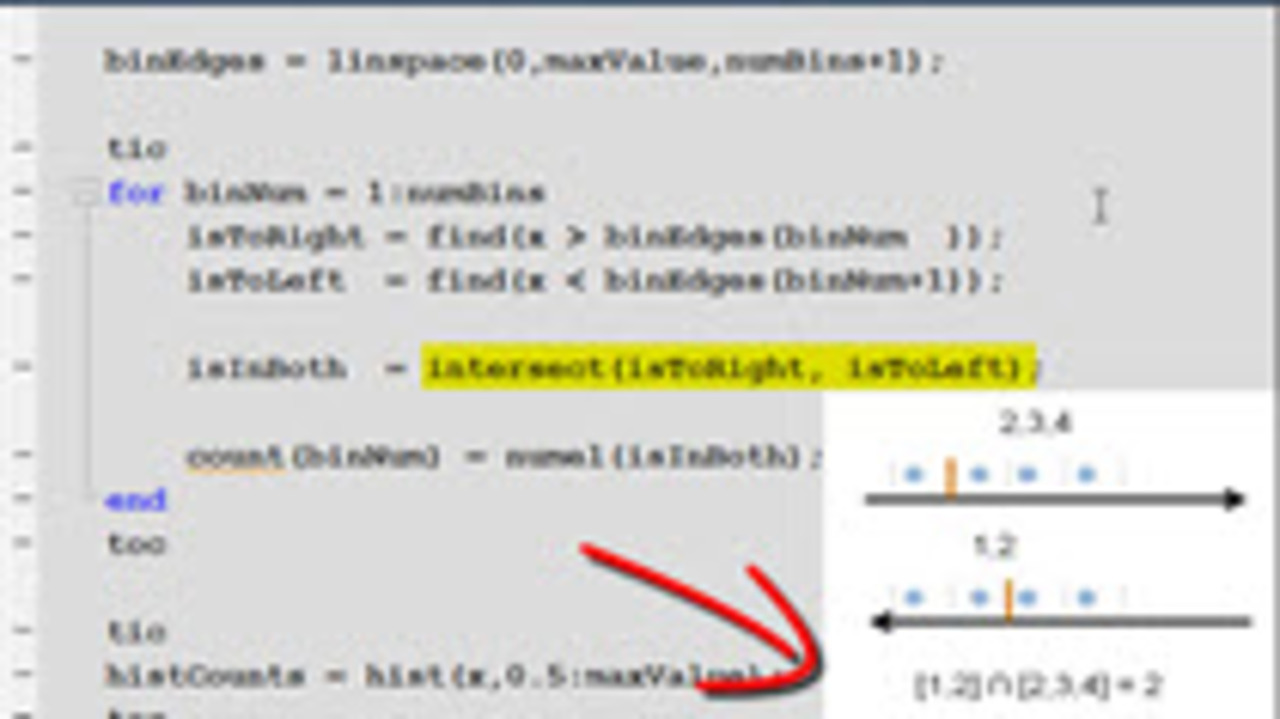
Sometimes the performance of MATLAB code can depend greatly on the algorithm or the specific functions called. In this example, we show how we use the profiler (and good knowledge of logical… 更多内容 >>
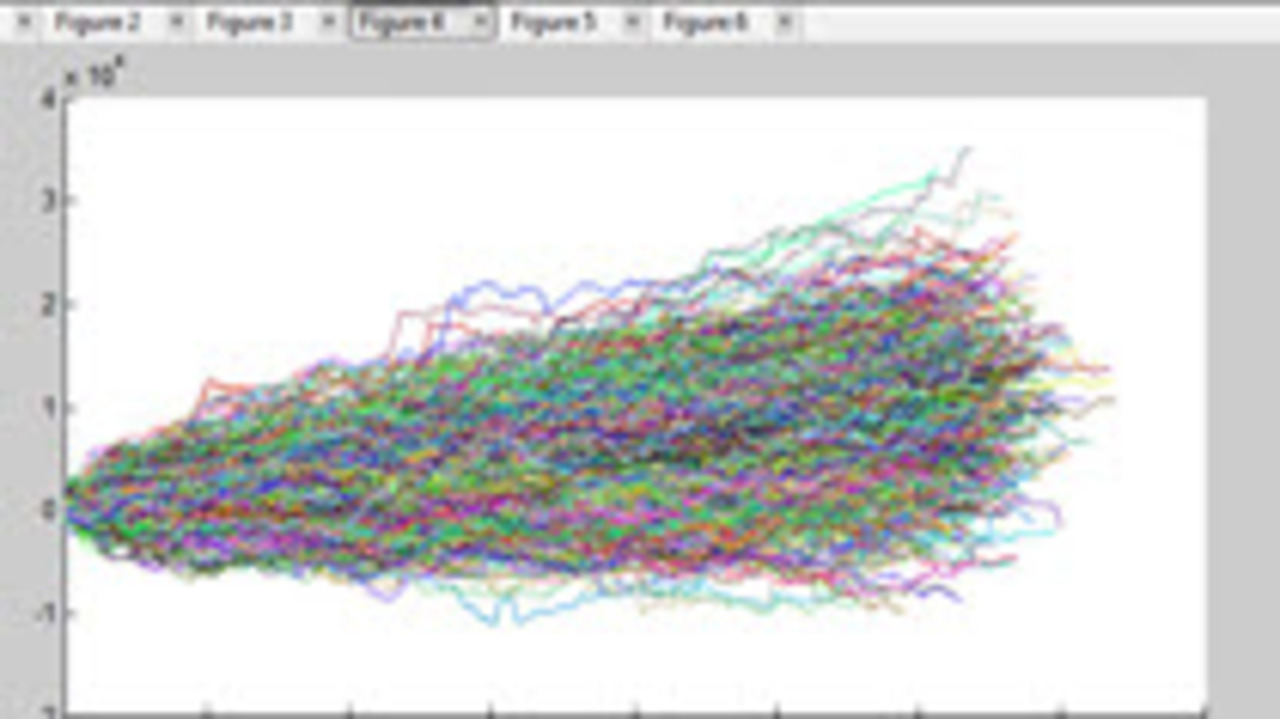
Continuing with the random walk data: We will be bootstrap sampling the prior data to get estimates of what the next series of samples could look like. if (typeof(playerLoaded) === ‘undefined’)… 更多内容 >>
这些文章由作者发布,不一定代表 MathWorks 的意见。
