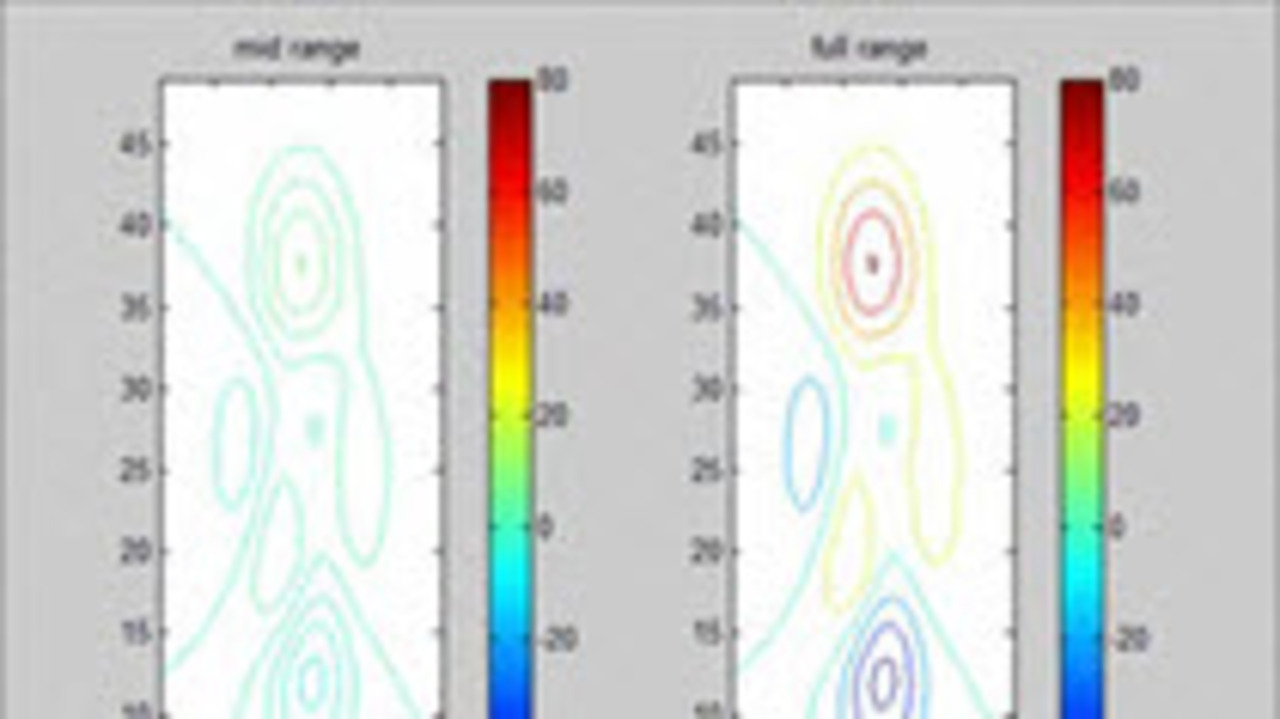
I love getting short, concise questions from fellow MATLAB users. One that I got recently looked like this: I have some data that I want to plot with contourf using a colormap that spans from 0 to… 続きを読む >>

I love getting short, concise questions from fellow MATLAB users. One that I got recently looked like this: I have some data that I want to plot with contourf using a colormap that spans from 0 to… 続きを読む >>

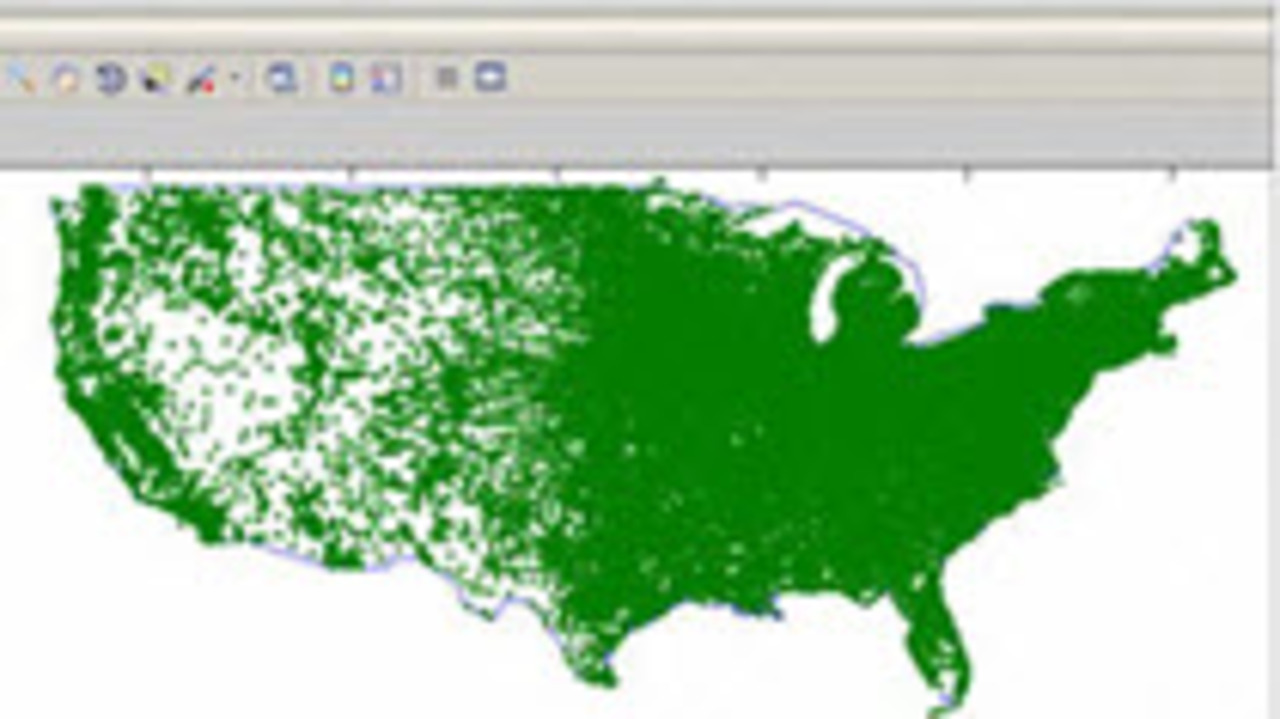
My colleague, Stuart, is the person behind that charming Scottish accent you hear on many of the MATLAB videos on our website. He recently posted several of his videos on the new MATLAB Channel on… 続きを読む >>
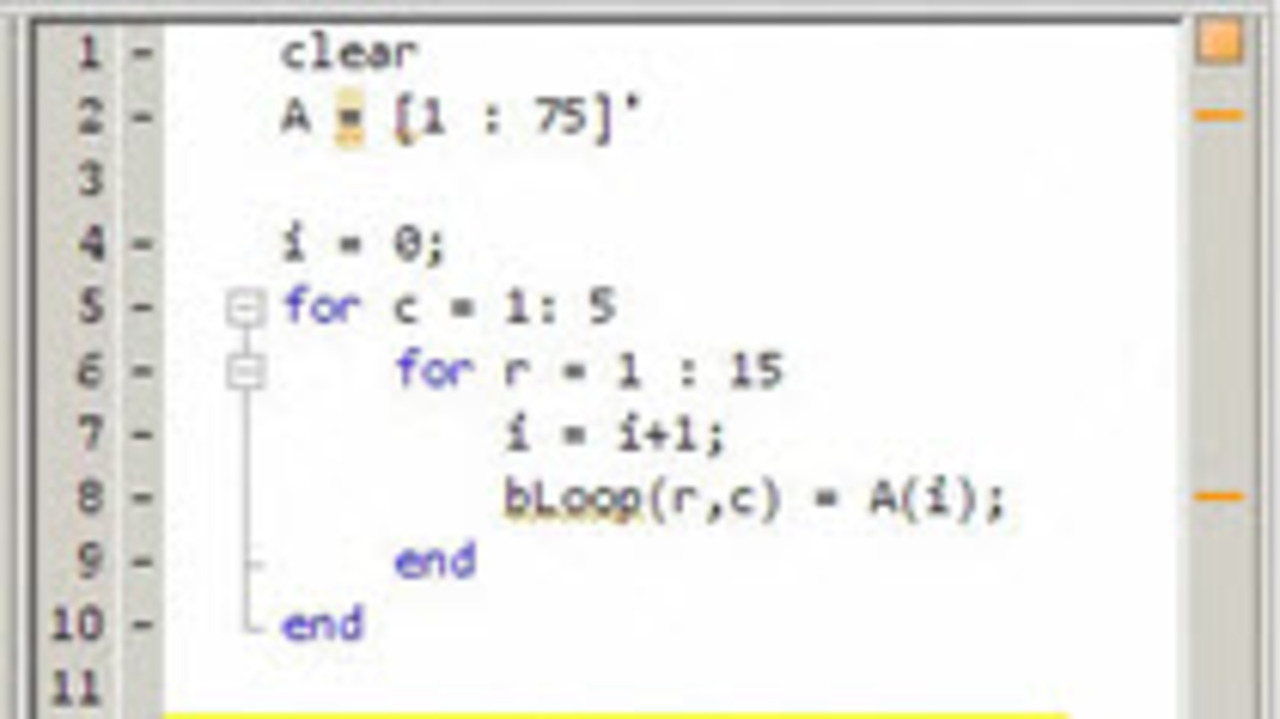
RESHAPE is a very useful function, but it is something that a lot of MATLAB users do not discover until someone is looking at their code and says “Why are you using a for loop for… 続きを読む >>
I am blogging a little early this week because of the holiday. What holiday would that be? Square Root Day– 03/03/09. What makes this a particularly special event is that today’s video… 続きを読む >>
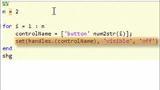
This short video shows how you can make your code shorter, more flexible, and readable by using a string variable to reference a field in a structure. This is called dynamic field name reference or… 続きを読む >>
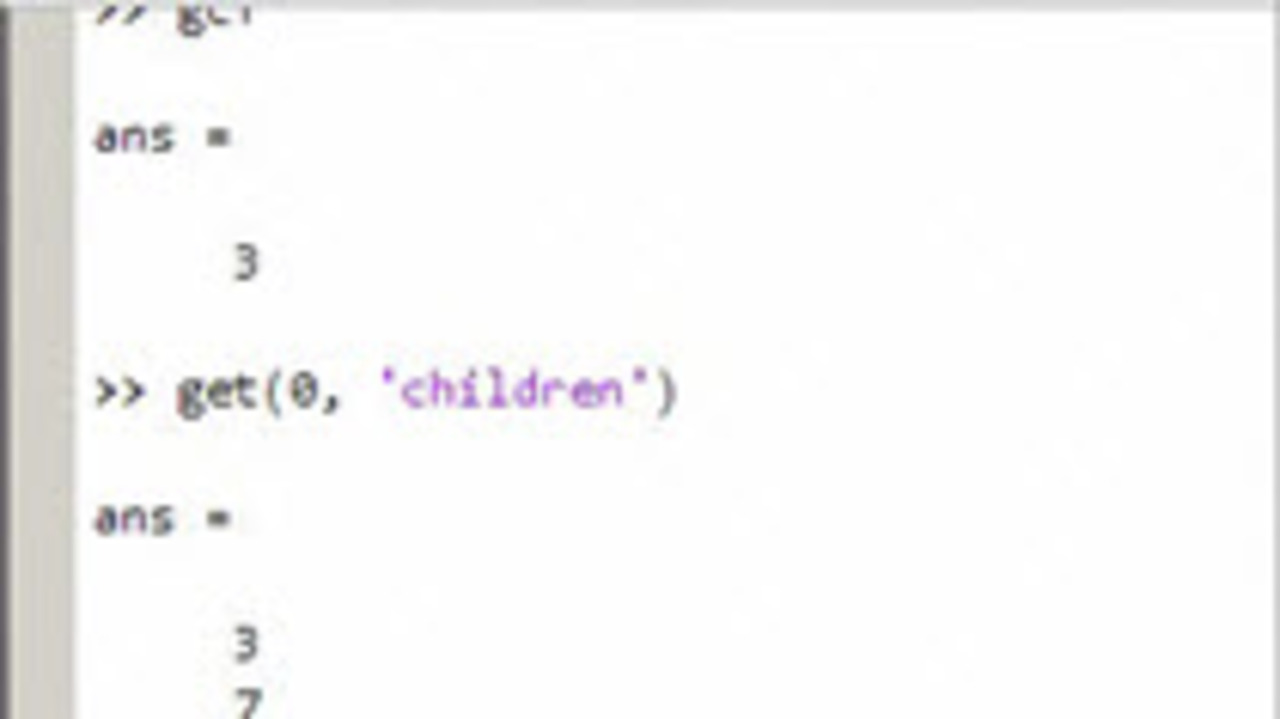
This was a question that came across my desk recently: “How do I know what figure numbers are already open?” The way to answer this is to query the “root” (always handle… 続きを読む >>
Often when I post code, there is a discussion of how to optimize it. I tend to subscribe to this maxim:
Rules of Optimization:
Rule 1: Don’t do it.
Rule 2 (for experts only): Don’t do… 続きを読む >>
clear num = [1 1 1 1 1 1 1]; den = [1 2 3 0 5 6 7]; for i = 1: numel(den) if den(i) == 0 a = 1 else … 続きを読む >>
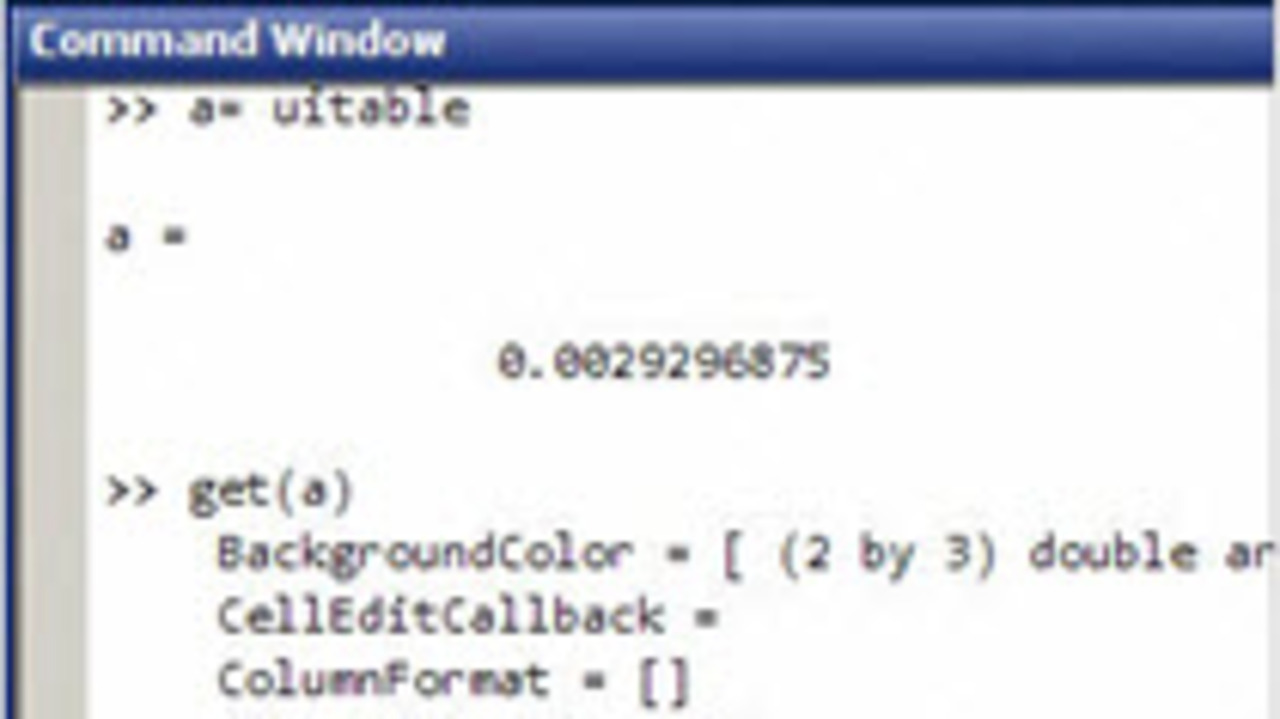
I got a question via e-mail that was asking how to set the data in a uitable. Setting the data in a uitable is as easy as: >> a = uitable >> set(a,’data’,… 続きを読む >>
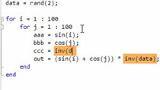
A statement like this: a = sin(x) + cos(y) + inv(z); makes it impossible to know which part of the calculation is the bottleneck. This video shows how to determine what is slowing your code… 続きを読む >>
これらの投稿は著者に属するものであり、必ずしも MathWorks の見解を示すものではありません。