Did you know that you can customize the direction of text in MATLAB plots? There are times when such annotations work better than if they were purely horizontal or vertical.
Contents
Sunspot Data
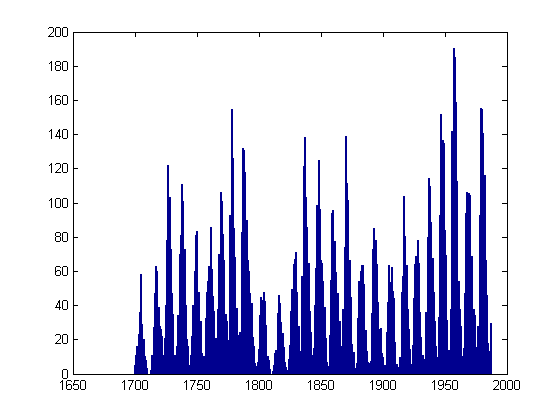
Let's look at some sunspot data. First I'll load it into MATLAB.
s = load('sunspot.dat');Separate the year from the actual number of sunspots.
year = s(:,1); spots = s(:,2);
Show the data in a bar plot.
bar(year,spots)
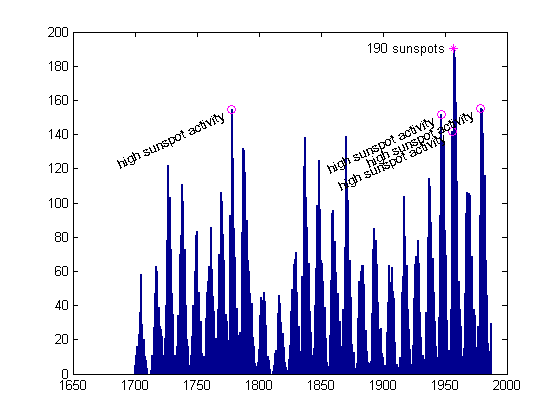
Annotate the Year with the Maximum Number of Sunspots
[smax, indmax] = max(spots);
The historical record shows the year
yearmax = year(indmax)
yearmax =
1957
with the maximum number of sunspots, 190.
hold on plot(yearmax, smax, 'm*') hold off ht = text(yearmax, smax,[' ',int2str(round(smax)), ' sunspots ']);
Use Handle Graphics to Alter the Annotation Orientation
Let's try labeling the maximum so the label is right-justified now.
set(ht,'HorizontalAlignment','right')
Now change the label so it is at an angle, something I might want if I were planning to label several more points on the graph.
set(ht,'Rotation',45)
Note Other Maxima
The sunspot cycle has a periodicity of about 11 years. Let's see which other years have a high number of sunspots.
[maxssa, indssa] = sort(spots,'descend');
year(indssa(1:10))ans =
1957
1958
1959
1979
1980
1778
1947
1956
1981
1870
We see some years near the maximum year, 1957, then another cluster near 1979, and the next at 1778. Let me grab the first five "distinct" clusters.
idxdistinct = [1 4 6 7 8]; year(indssa(idxdistinct))
ans =
1957
1979
1778
1947
1956
Label Extra Peaks
Let's label these few other peaks in a similar manner to the first one.
nearMaxYears = year(indssa(idxdistinct(2:end))) ssaMax = spots(indssa(idxdistinct(2:end))) hold on plot(nearMaxYears, ssaMax, 'mo') hold off hn = text(nearMaxYears, ssaMax,[' high sunspot activity '],... 'HorizontalAlignment','Right','Rotation',25); set(ht,'Rotation',0)
nearMaxYears =
1979
1778
1947
1956
ssaMax =
155.4000
154.4000
151.6000
141.7000
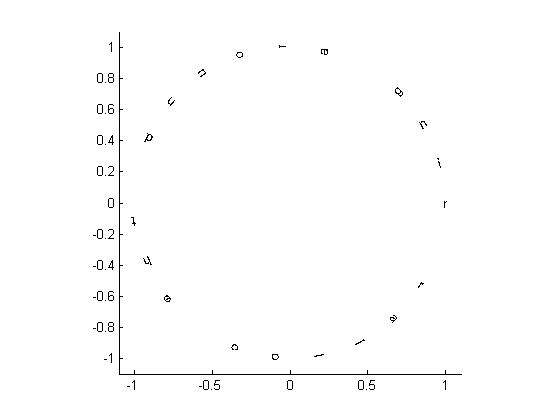
Write Around a Circle
Just for fun now, let's write a phrase around a circle of radius 1.
clf, box on phrase = 'ring around the collar '; num = length(phrase) angles = 0:(360/num):359; x = cos(angles*pi/180); y = sin(angles*pi/180); for ind = 1:length(phrase) text(x(ind),y(ind),phrase(ind),'Rotation',angles(ind),... 'HorizontalAlignment','center') end axis equal, axis([-1.1 1.1 -1.1 1.1])
num =
23
References
There is a whole lot more you can do with text annotation in MATLAB. Here are some references for the language aspects of working with text.
Though I don't want to turn this blog into one chiefly about graphics, I think I can cover some aspects here and still talk about it in terms of the language. Any suggestions? Please post them here.
Get
the MATLAB code
Published with MATLAB® 7.4

So how do we rotate ticklabels?
Tom-
Ticklabels are not regular text elements in a MATLAB plot currently and can’t be rotated like a regular text annotation. That request is in our enhancement database.
–Loren
Not that I expect you to do anything about it, but why does ML do such a terrible job of rendering rotated text? I would think that a system with a TeX interpreter built in would be able to do *much* better.
Dan K
Dan-
First, the TeX interpreter and text rendering are decoupled in MATLAB. That aside, you are right that rotated text currently doesn’t look so great. It’s in the longer term plans to update the underlying graphics infrastructure so better rendering technology can be substituted in the future.
–Loren
Loren, I’m glad to hear about the planned improvement.
Tom, as a side item, I have faked the rotated tick labels by using text in the past. It is kludge-y in the extreme, but it did work. The meat of the command I use is:
for iTick
th=text(iTick,yoff,p.n1{iTick},’rotation’,-45,’HorizontalAlignment’,'Right’);
where p.n1 contains the labels, iTick steps through the tick marks themselves, and yoff offsets the text so it is outside of the axes. (BTW. this was for labels across the top of the plot). I don’t know if it helps or not, but it dealt with my need, however poorly.
-Dan
Loren, while understandably you are reticent to discuss graphics in your own blog, going by the numbers of graphical related queries in the newsgroup, perhaps a graphics dedicated blog would be of interest to many.
I find it odd that ML can do so much with text objects, but can not handle the following simple request:
x=linspace(-pi,pi);y=sin(x);
plot(x,y)
set(gca,’XTick’,(-pi:pi/2:pi))
set(gca,’XTickLabel’,{’-\pi’,'-\pi/2′,’0′,’\pi/2′,’\pi’})
This means that I can not use ML alone to produce publication-quality figures with symbolic tick labels. Surely this has been on the ‘to-do’ list for a long time? Why is it not yet possible?
Steve-
This request is on the enhancement list. I don’t get into discussions here about timing typically.
The workaround for now is to replace the ticklabels with text. text can use the TeX interpreter and get the symbols such as pi into the label.
–Loren
Loren,
the workaround you suggest requires that I know where to put the text; is there a simple way to obtain this information about existing labels? Or have I misunderstood your suggestion?
-Steve
Steve-
You know where the text is roughly in one dimension for each axis (e.g., you know the centered horizontal locations from the Xtick values). But there is not a simple way to inquire about the exact position. There is no doubt that this is currently awkward to achieve.
–loren
Hi Loren,
I just wanted to point out a problem I have for years with MATLAB about the datetick.
It seems that once you decided to use datetick to plot dates on your axe, once you have zoomed between two ticks, you loose the ticks…
I developped a small function to be able to zoom and keep ticks: I rewrite the date labels using the text function…
%% Example
figure
plot(today-100:today,cumsum(randn(101,1)))
datetick
ax=axis;axis([today-10 today ax(3:4)])
title(’Where have my other ticks gone?’)
The ability to rotate xlabel text by an arbitrary angle would be fantastic. +1 vote by me.
I have performed something similar to the kludge mentioned by Dan K before, but as mentioned by lehalle, you get very strange behaviour when zooming.
Imagine the case when you have set your own XTickLabels, the the silly user zooms on a region.. what happens? The same labels are reused!! A complete disaster.
Now what WOULD be useful (and may exist but I cannot for the life of me find it) would be a OnZoom callback. I can imagine lots of cool things that can be performed with this, particularly in a GUI aspect. And then the horrible lable kludge can be hidden in a nice compact reuseable piece of code and will actually work over all zoom ranges.
(by the way - to get around the problem previously I have created a Timer of interval 0.1 second that continuously polls the axis and axis tic locations, and if they have changed, update the plots… nowhere near as nice)
(sorry for the long post)
- Rod
another vote for supporting vertical axis labels in matlab. what a pain. :(
Rodney -
MATLAB does have the equivalent of the OnZoom callback. It’s a zoom property called ActionPostCallback. Check out the help for ZOOM for explanations and examples.
Regardless, we are aware of the issues with datetick and rotated tick labels, and are very interested in addressing these in a future release.
- scott