
Basics: Volume visualization: 9/9 Unifying example
This short video is the final of a series of nine that talks about volume visualization. Patrick gave this talk internally to help technical support engineers understand capabilities of MATLAB for volume visualization.
I like his slow, clear, methodical presentation with great visualizations. It is the first time I have deeply understood some of the volume visualization techniques we have.
- 1 of 9 Definitions for scalar and vector fields.
- 2 of 9 Examples of scalar and vector fields (temperature in a room vs air currents)
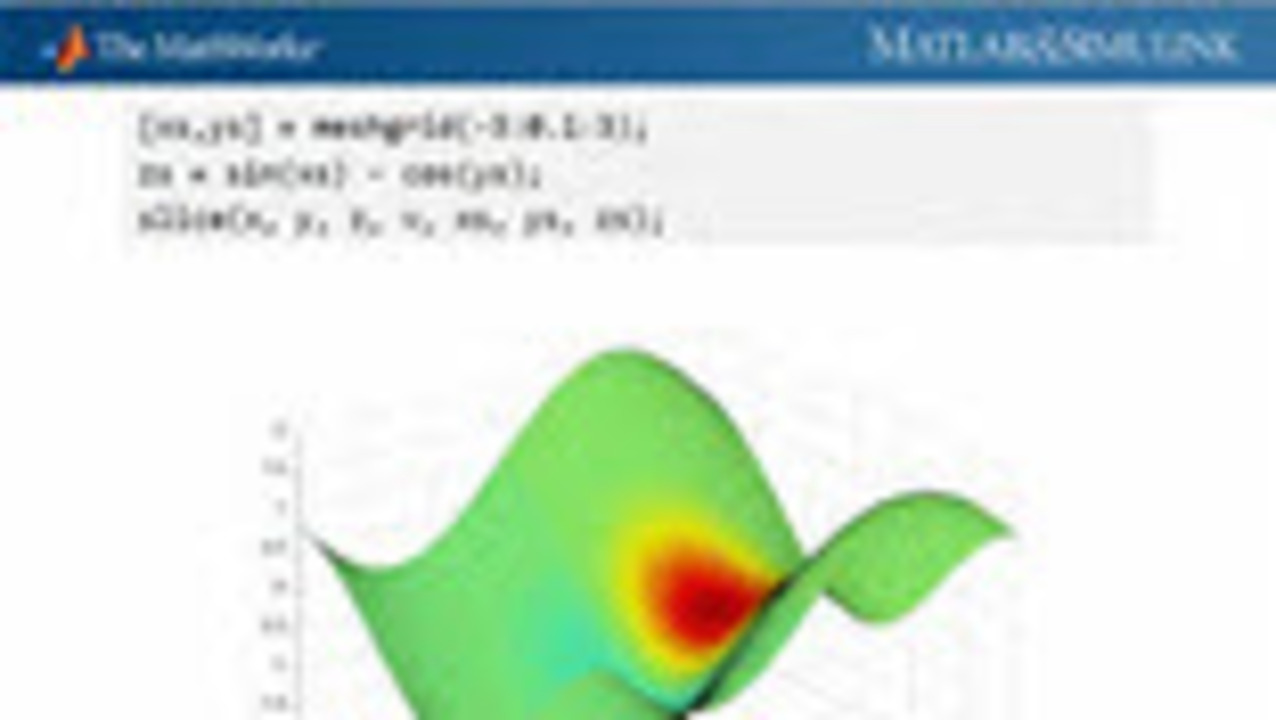
- 3 of 9 Displays scatter3 and slice plots.
- 4 of 9 Displays contourslice and isosurface.
- 5 of 9 Making a 3-d plot ‘pretty’ with lighting, shading, interpolation, etc…
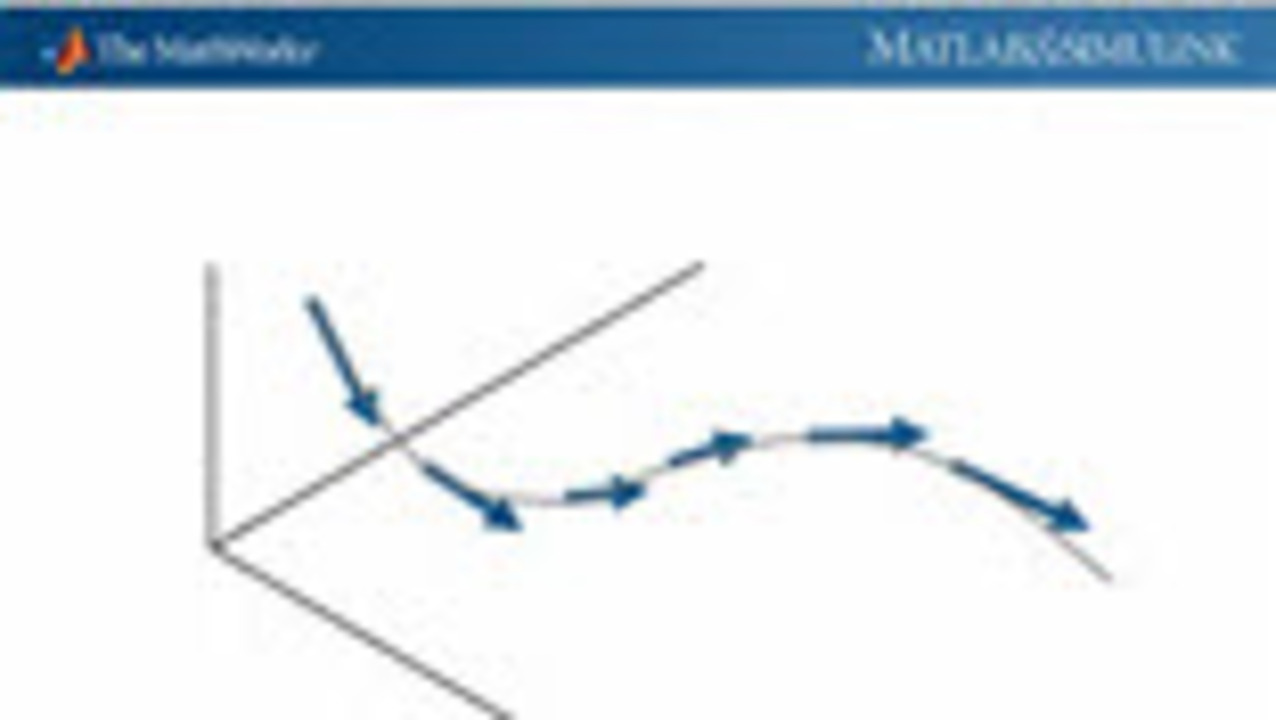
- 6 of 9 Displays quiver3 and coneplot
- 7 of 9 Displays and explains streamplot and streamslice
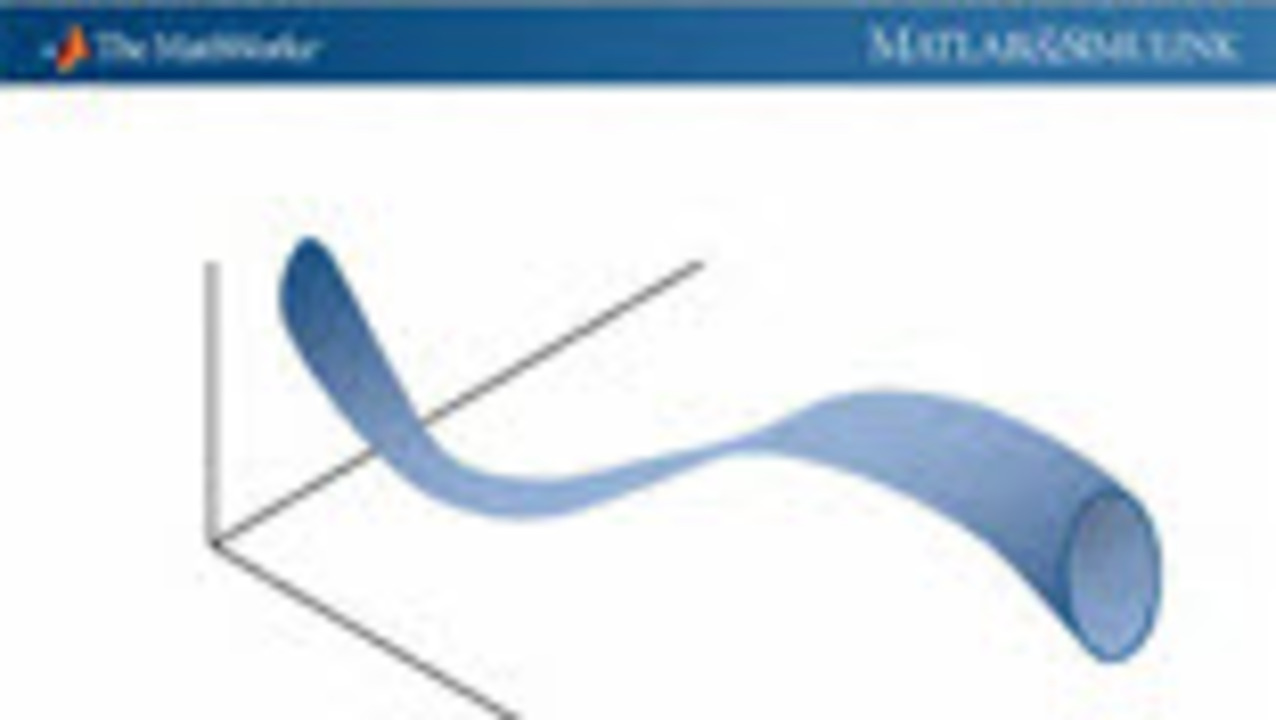
- 8 of 9 Displays and explains streamtubes and streamribbons
- 9 of 9 Unifying example
- Category:
- Format: Video,
- Level: Basic


Comments
To leave a comment, please click here to sign in to your MathWorks Account or create a new one.