Advice for Making Prettier Plots
A few years ago, Jiro wrote a popular post for making pretty plots on this blog. We also host a blog specifically about graphics by Mike. And with the R2014b release of MATLAB came an updated graphics system that Dave described last year in a 3 part series: Part 1, Part 2, and Part 3.
Even with that, I continue to hear questions about how to accomplish certain tasks, such as using a symbol to indicate degrees. This post contains a collection of a few tips that may help you update your plots to match more closely what you are trying to convey.
Contents
Plotting Temperature Data
Suppose we have some temperature data to plot and want to add tick marks that include the degree symbol. Here's some ways to achieve this.
Mock up data for the first of each month this year.
t1 = datetime(2014,1:12,1);
temp = [0 2 12 11 15 25 23 27 25 24 12 8];
Add Y Label with Degree Symbol
h = plot(t1,temp,':*');
ax = h.Parent;
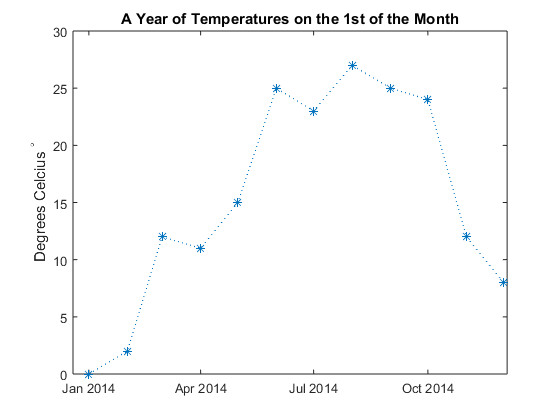
title('A Year of Temperatures on the 1st of the Month')
ylabel('Degrees Celcius ^{\circ}')
Find the Y Labels
ytl = ax.YTickLabel
ytl =
    '0'
    '5'
    '10'
    '15'
    '20'
    '25'
    '30'
Append the Degree Symbol
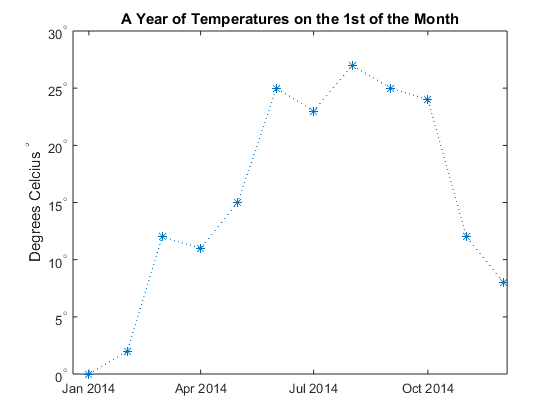
ytld = strcat(ytl,'^{\circ}')
ytld =
    '0^{\circ}'
    '5^{\circ}'
    '10^{\circ}'
    '15^{\circ}'
    '20^{\circ}'
    '25^{\circ}'
    '30^{\circ}'
Reset the Labels
ax.YTickLabel = ytld;
Suppose the Y Axis is Money, Not Degrees
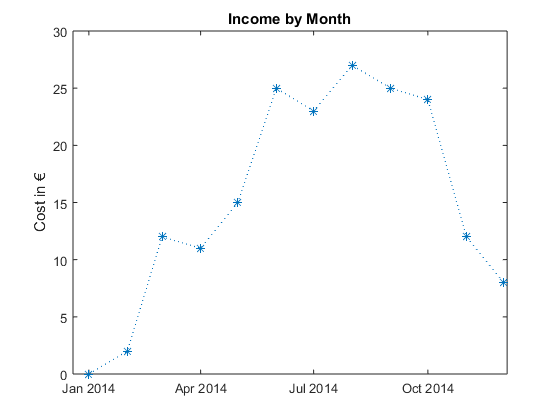
First replace the labels with the original values. Then update the Y axis label. If you want to use the € symbol and it is not on your keyboard, you can use char(8364); $ is char(36).
ax.YTickLabel = ytl;
ylabel('Cost in €')
title('Income by Month')
Update the Y Tick Labels with Euros
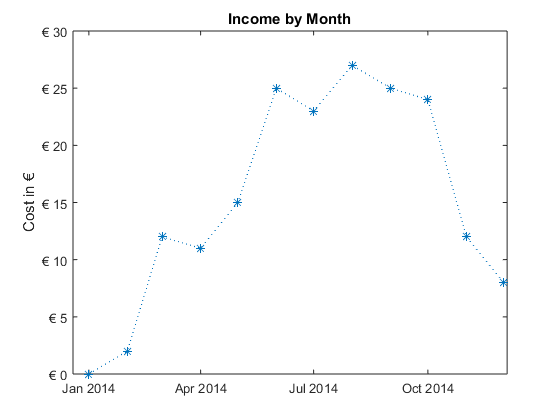
Since we want to set all the labels at once, we want to return the results back into a cell array, hence the false setting for 'UniformOutput'.
ax.YTickLabel = cellfun(@(x)sprintf('€ %s',x),ax.YTickLabel,'UniformOutput',false)
ax =
  Axes (Income by Month) with properties:

             XLim: [7.3559e+05 7.3594e+05]
             YLim: [0 30]
           XScale: 'linear'
           YScale: 'linear'
    GridLineStyle: '-'
         Position: [0.13 0.11 0.775 0.815]
            Units: 'normalized'

  Use GET to show all properties
Finally Annotate a Plot with Some Math
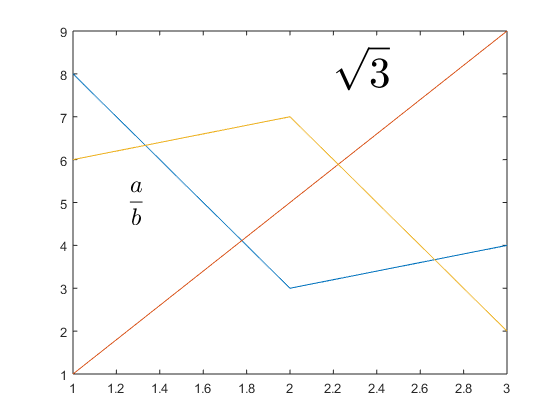
Just create the latex expression for the math, and call text, with the 'interpreter' parameter set to 'latex'.
plot(magic(3))
t1 = text(1.25,5,'$$\frac{a}{b}$$');
t1.FontSize = 18;
t1.Interpreter = 'latex';
t2 = text(2.2,8,'$$\sqrt{3}$$','FontSize',32,'Interpreter','latex');
Call to Action
Do you annotate your plots frequently? What do you need to show?




Comments
To leave a comment, please click here to sign in to your MathWorks Account or create a new one.