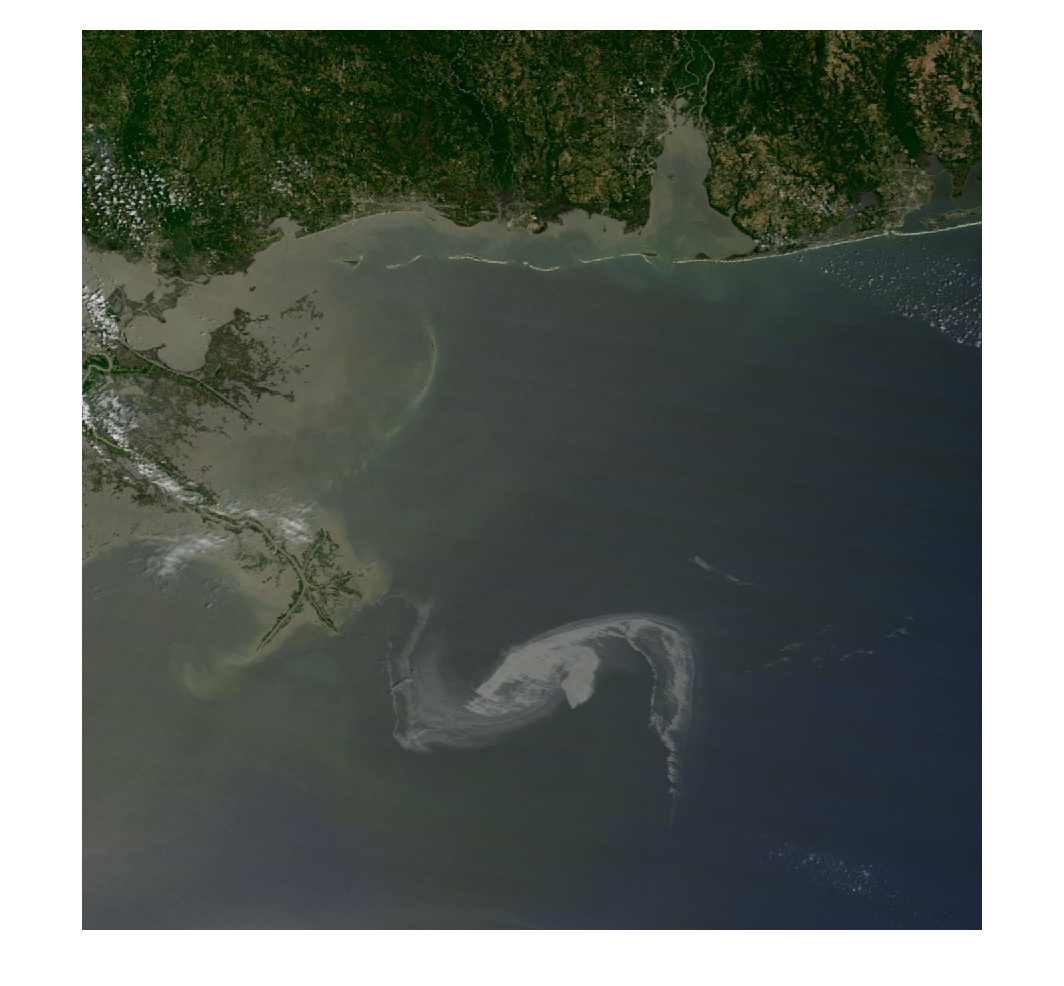
Advanced: Loading, filtering and displaying geographic data with the Mapping Toolbox.
This short video uses the Mapping Toolbox to load in the state boundaries in a given area and display them on a special map axis. Random points are also generated and filtered based on their location.


评论
要发表评论,请点击 此处 登录到您的 MathWorks 帐户或创建一个新帐户。