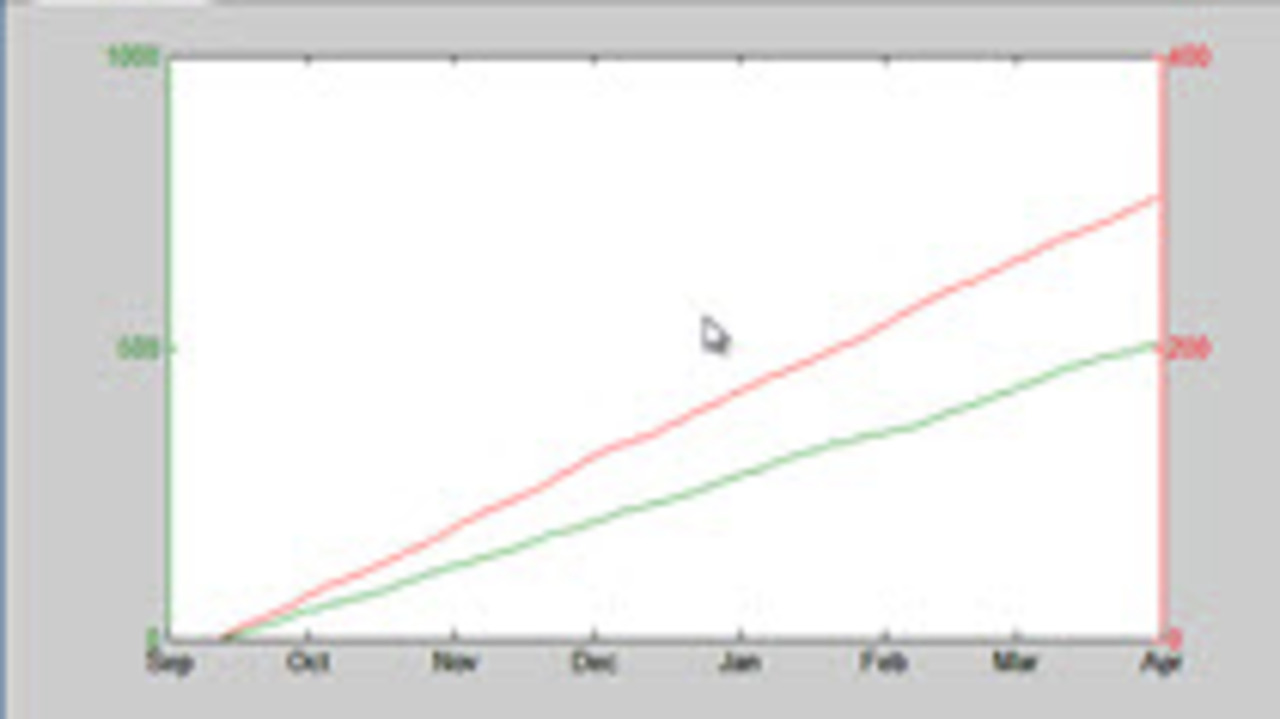
Recently, I needed to plot two different sets of time series data on the same axes, but they were at different scales. In this simplified example, I show how you can change the x-labels to display… 続きを読む >>

Recently, I needed to plot two different sets of time series data on the same axes, but they were at different scales. In this simplified example, I show how you can change the x-labels to display… 続きを読む >>

In this video we are sorting through some data making a different line for all the data points that match certain criteria. At some point in the algorithm none of the data meets the criteria. This… 続きを読む >>
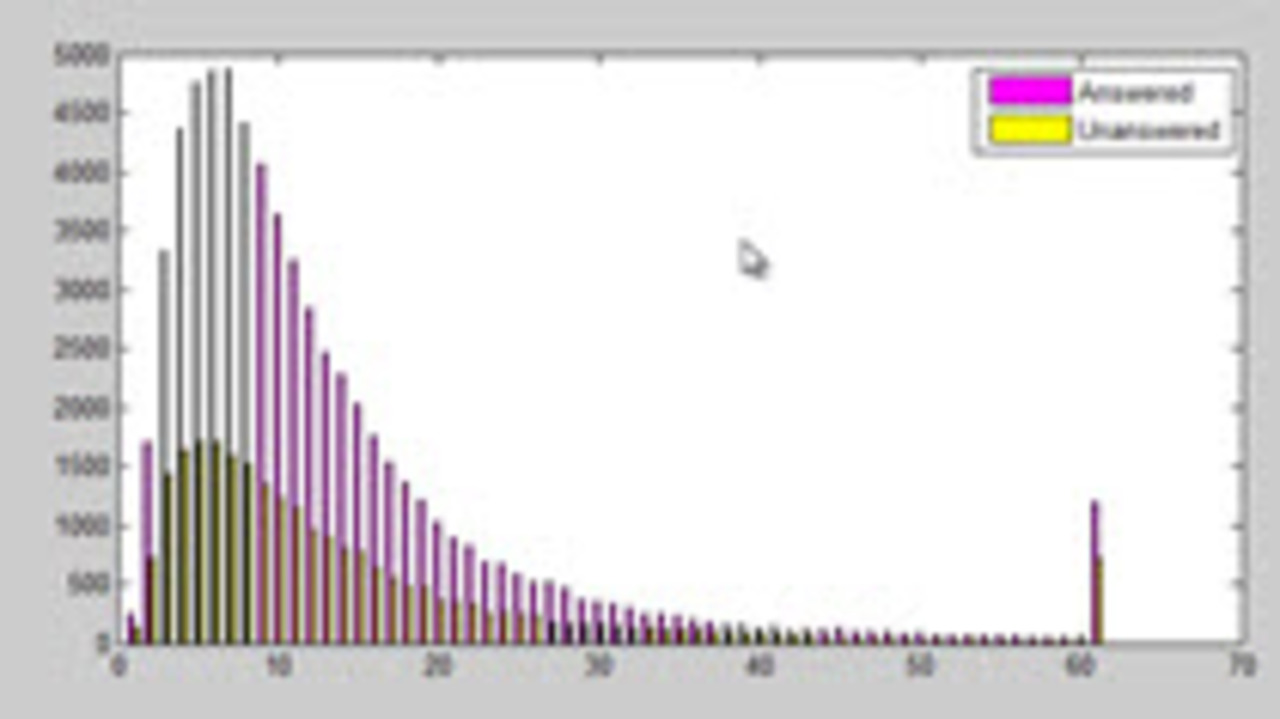
When we get unknown data, we do not always know where it will lead us. This video shows the series of visualizations that I went through to answer a question about my data. By showing the process,… 続きを読む >>
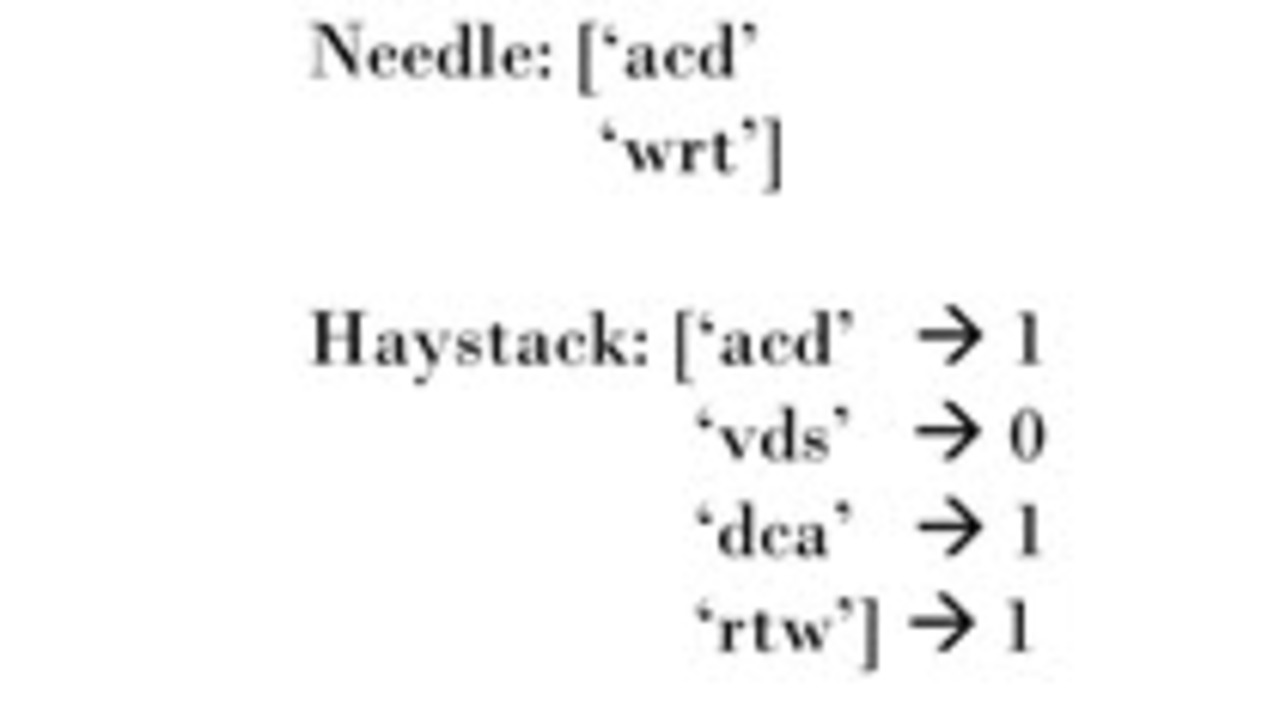
In this video a colleague was looking in a large list to see if each element was a permutation of any element of a shorter list. I name these lists Haystack and Needle so it is easy to remember… 続きを読む >>
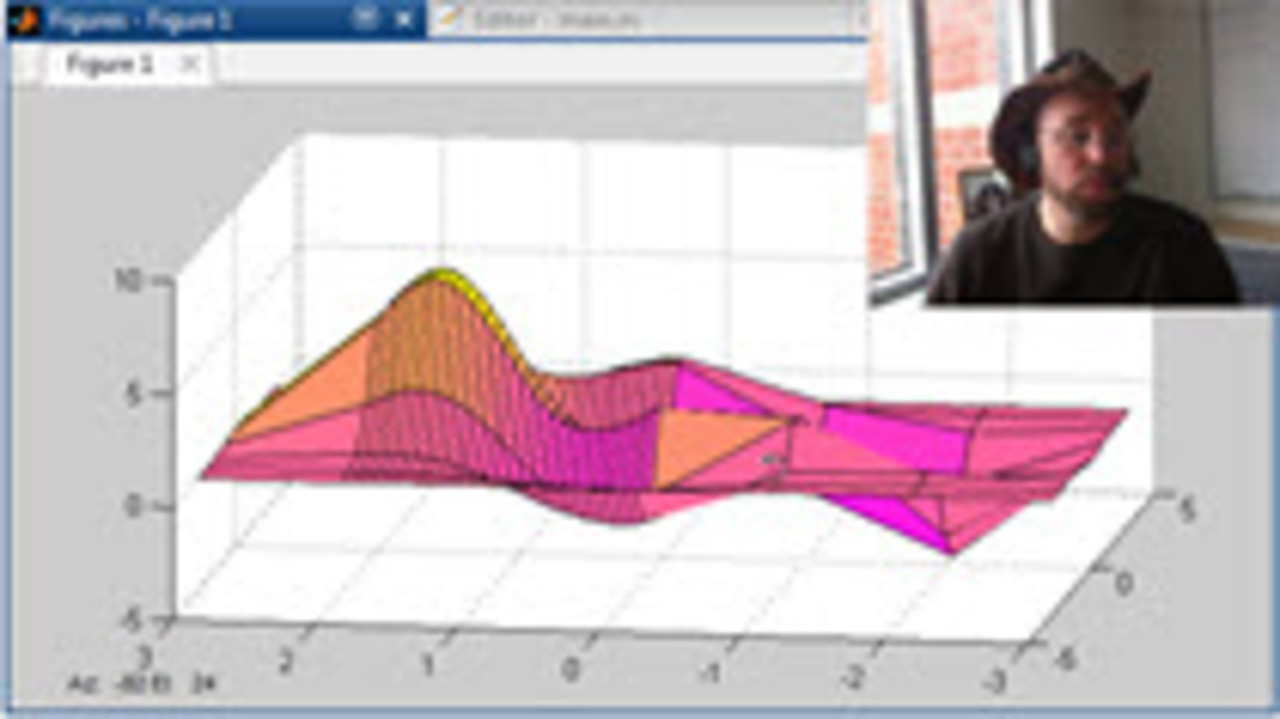
In this video, we will use non-uniform spacing for the X vector going into a surf plot in MATLAB. This allows us to selectively increase the resolution of a graphic in the more important regions. … 続きを読む >>
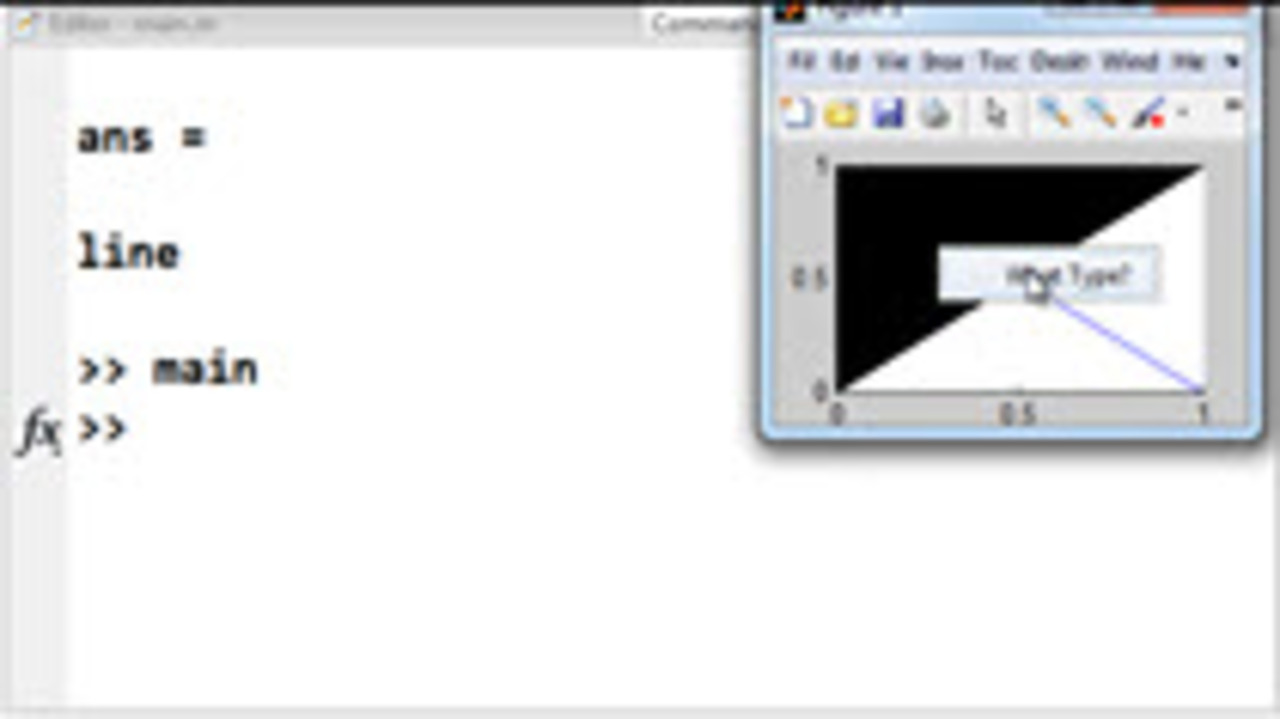
When you use ButtonDownFcn in MATLAB, your callback is given an automatic input called hObject. This hObject is the handle of the object that you interacted with to invoke the callback, which makes… 続きを読む >>
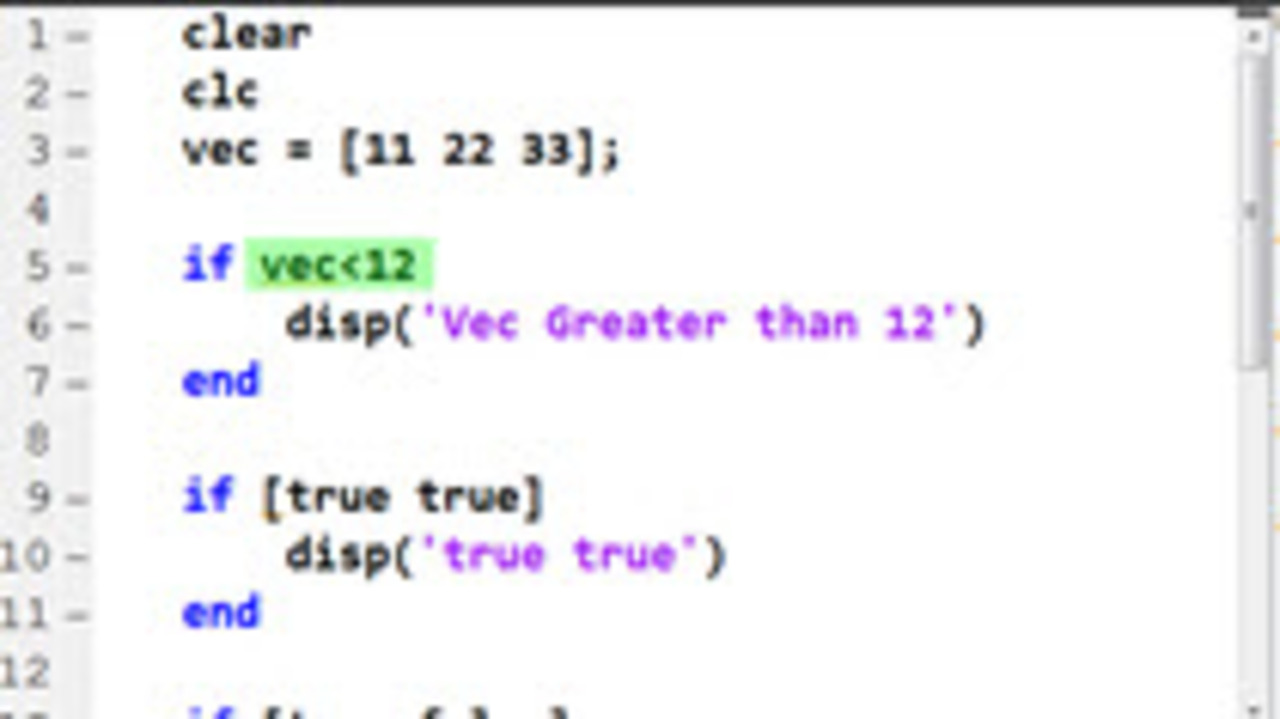
In teaching new MATLAB users, I often see them accidentally use a vector as an input to an if statement. This is not likely what they intend and it is often an overlooked syntax error. In this… 続きを読む >>
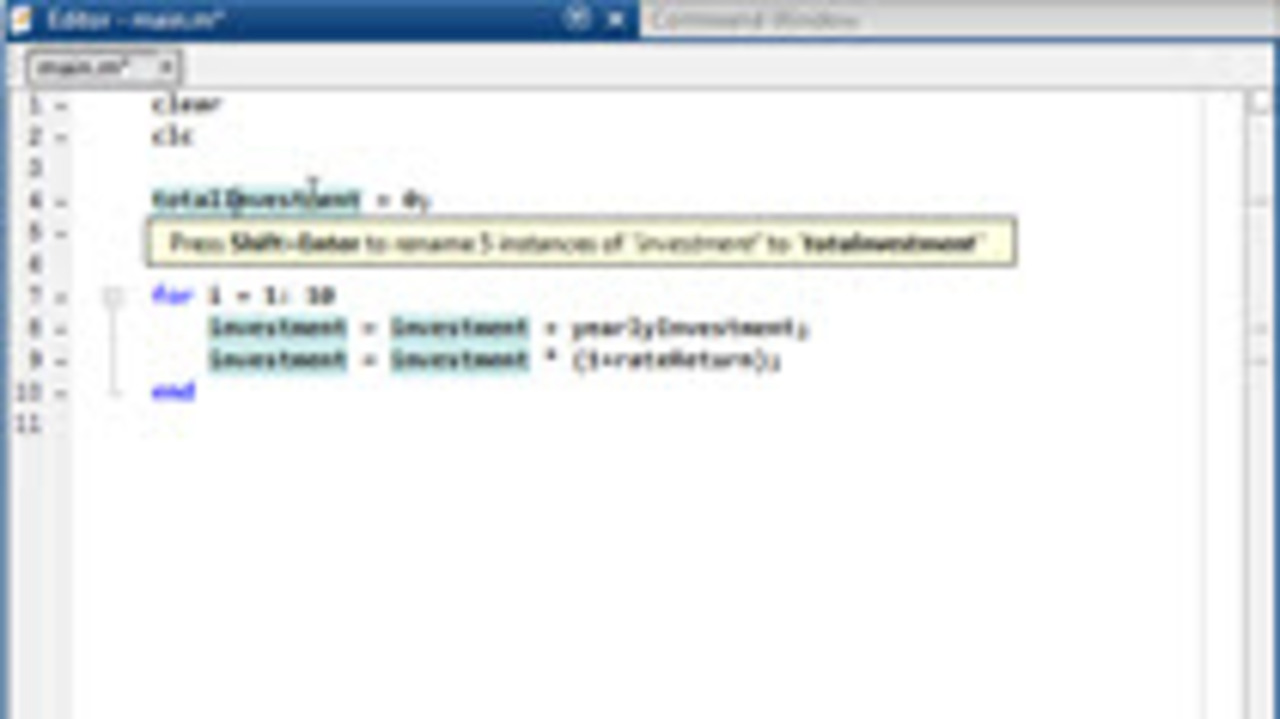
As code matures, very often the nature of variables becomes better understood and the names of the variables need to change to reflect that better understanding. This short video shows how the… 続きを読む >>
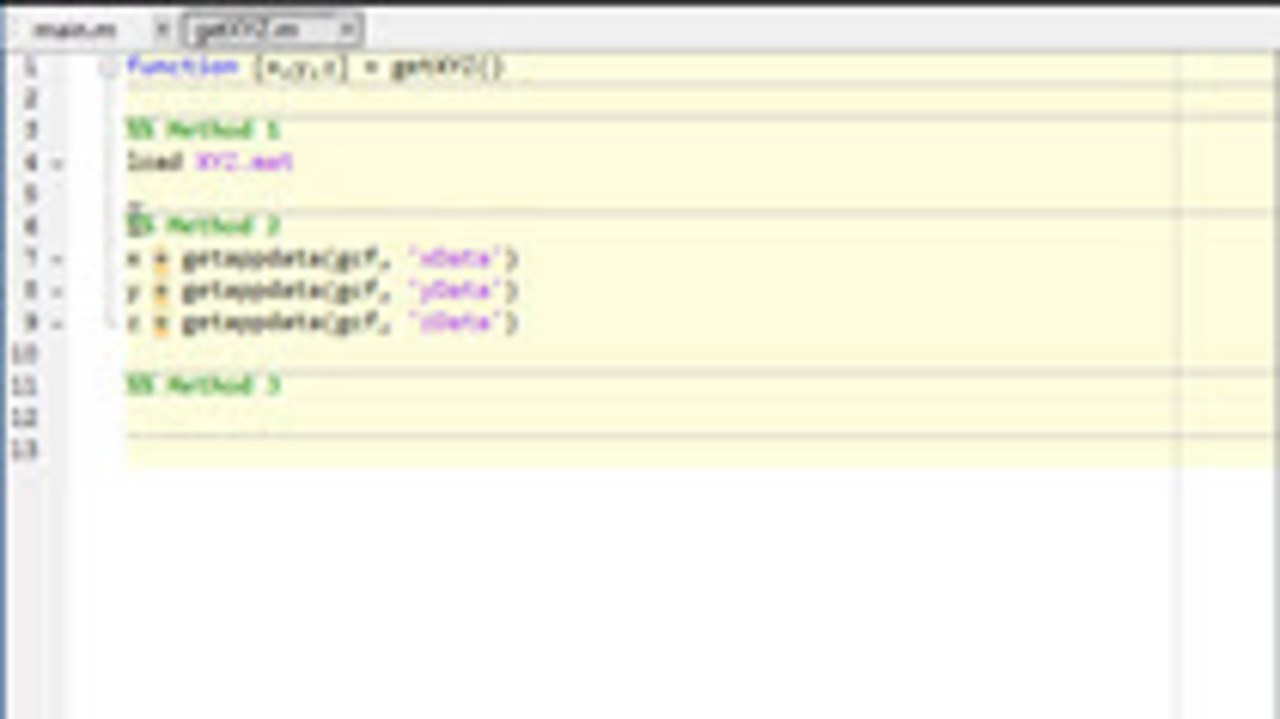
I am working on a large scale project that involves many broad topics like loading data, and visualizing. Both of these are important, but I needed to work on the visualizing immediately. I knew I… 続きを読む >>
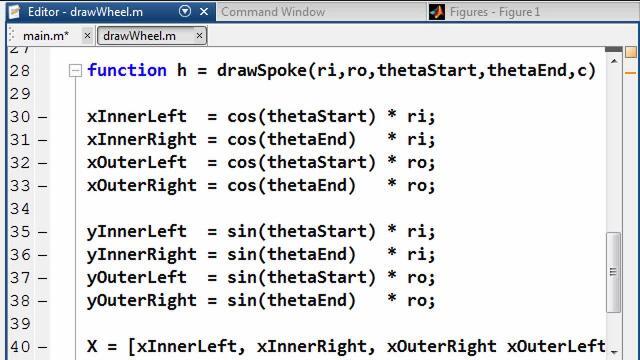
Custom visualizations in MATLAB can be made to show your data however you think best. Today’s visualization looks like it might be difficult, but it was actually done with one strategic… 続きを読む >>