
How Mature is your Model-Based Design Deployment?
Last week I took part in a presentation about the Model-Based Design Process Assessment™ offered by the MathWorks Consulting Services.
I was impressed to see how deep this assessment goes to identify the strengths and weaknesses of the methods, tools, practices, organizational structure, and environment used in your current MBD workflow... and of course at the end coming up with both immediate and long term improvement plans.
If your organization is using Model-Based Design for Production Real-Time Embedded Systems, you might be wondering how you benchmark against leaders in your industry. Maybe you need to know the best way to eliminate redundant processes or tools, and reduce duplication of efforts – and how to standardize these things across your entire company. Perhaps you now want to change your development process to meet a certification standard (like DO-178, ISO 26262 or IEC 61508). If you’re seeing yourself in any of those scenarios, or if you want to improve overall efficiency or check how you’re doing 3 or 5 years into your Model-Based Design efforts, a Process Assessment might be for you.
Model-Based Design Process Assessment and Maturity Framework
After working with multiple organizations in various domains, our team of experienced engineers identified six core competencies crucial to deploying a mature Model-Based Design development environment. These six pillars were then decomposed into Process Groups, and further broken down into over 200 Process Attributes:
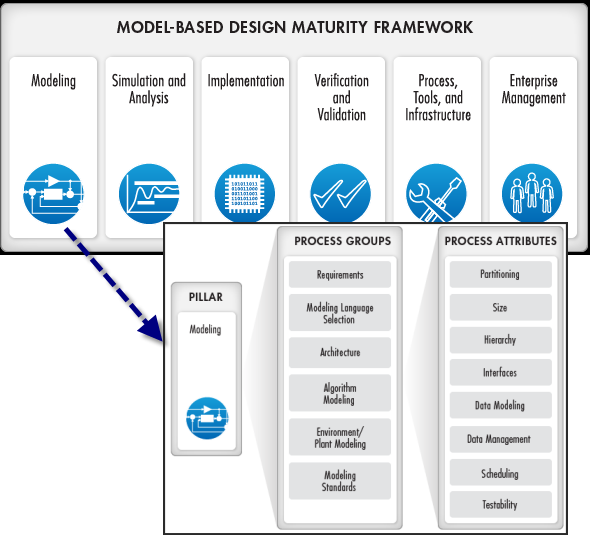
After spending time in your organization, evaluating your processes and interviewing employees, our Consulting Services group will be able to tell you how your adoption of Model-Based Design compares with other companies in your industry and identify key areas that could be improved to add value to your organization. An implementation plan suggests a structured set of activities to achieve immediate and long term results.
This radar chart, with the Pillars as the main spokes, compares the maturity assessments between leaders (top 20%), average, and laggards (bottom 20%) in the automotive industry based on Process Assessments performed by MathWorks. Where does your organization fit in?

Now it's your turn
Look at the Model-Based Design Process Assessment and Maturity Framework to get more details on how it could help your organization.
Have you already used this service? Are you interested? Let us know by leaving a comment here.
- Category:
- Model-Based Design


Comments
To leave a comment, please click here to sign in to your MathWorks Account or create a new one.