
Tiled Layout
Sean‘s pick this week is tiledlayout by MathWorks’s development team.
R2019b shipped on September 12th and is now available for download!
Check the Release Notes for all of the updates.
Contents
subplot’s Replacement
I imagine most of you have probably used subplot at some point.
Subplot alternatives or extensions are very popular on the File Exchange. In fact, I think it may be the most popular topic of contributions to the FEX. A quick search reveals many of the pains associated with subplots:
- Too much spacing between them
- Too much padding on the edges
- Difficulty in arranging the axes based on figure size
- Scaling issues
Enter R2019b, and tiledlayout. Tiled layouts give us all of the above. Let’s look at two examples: minimizing whitespace, and resizing/rescaling.
Minimize Whitespace
Create a tiledlayout, and use nexttile to traverse it.
figure
tlt = tiledlayout(2, 2);
nexttile
plot(sin(1:100));

nexttile
surf(peaks)

nexttile([1 2]) % Spanned
ribbon(sin(1:100), cos(1:100))
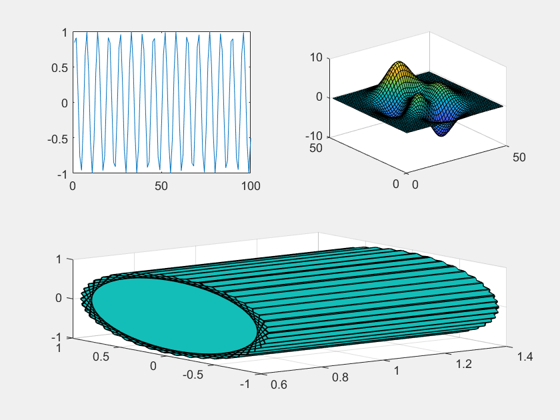
And let’s get rid of that whitespace!
tlt.Padding = "none";
tlt.TileSpacing = "none";
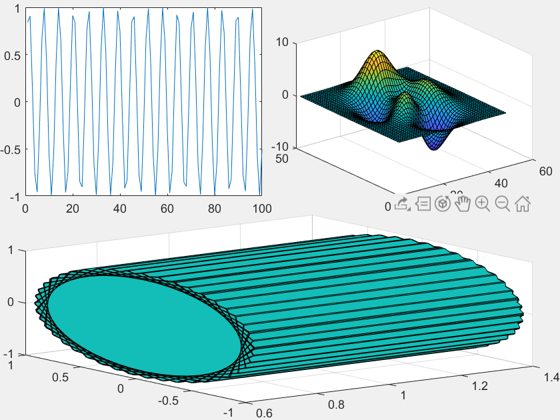
Reflow
The above example used a fixed grid of 2×2 like you might use with subplot. There’s also an option to “flow” which will rearrange the plots based on the figure size.
figure
tlt = tiledlayout("flow");
nexttile
plot(sin(1:100));

nexttile
surf(peaks)

nexttile
ribbon(sin(1:100), cos(1:100))
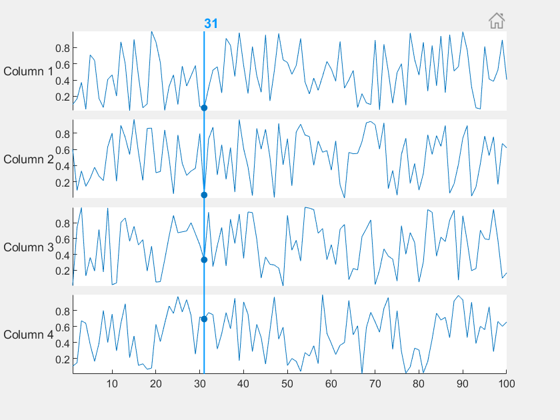
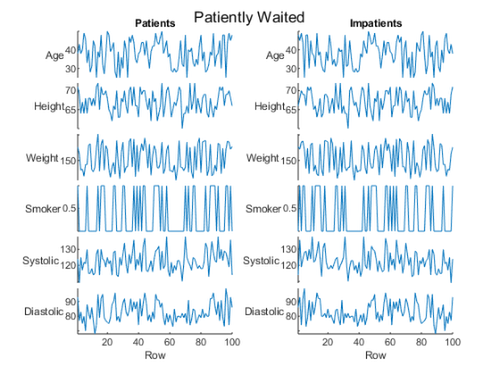
Stacked Plot
Additionally, if you’re using sub plots or tiles to show many variables against the same x-axis, you may want to look at stackedplot which does this for you.
figure
stackedplot((1:100).', rand(100, 4));
Comments
Give it a try and let us know what you think here.
Published with MATLAB® R2019b
- Category:
- Picks


Comments
To leave a comment, please click here to sign in to your MathWorks Account or create a new one.