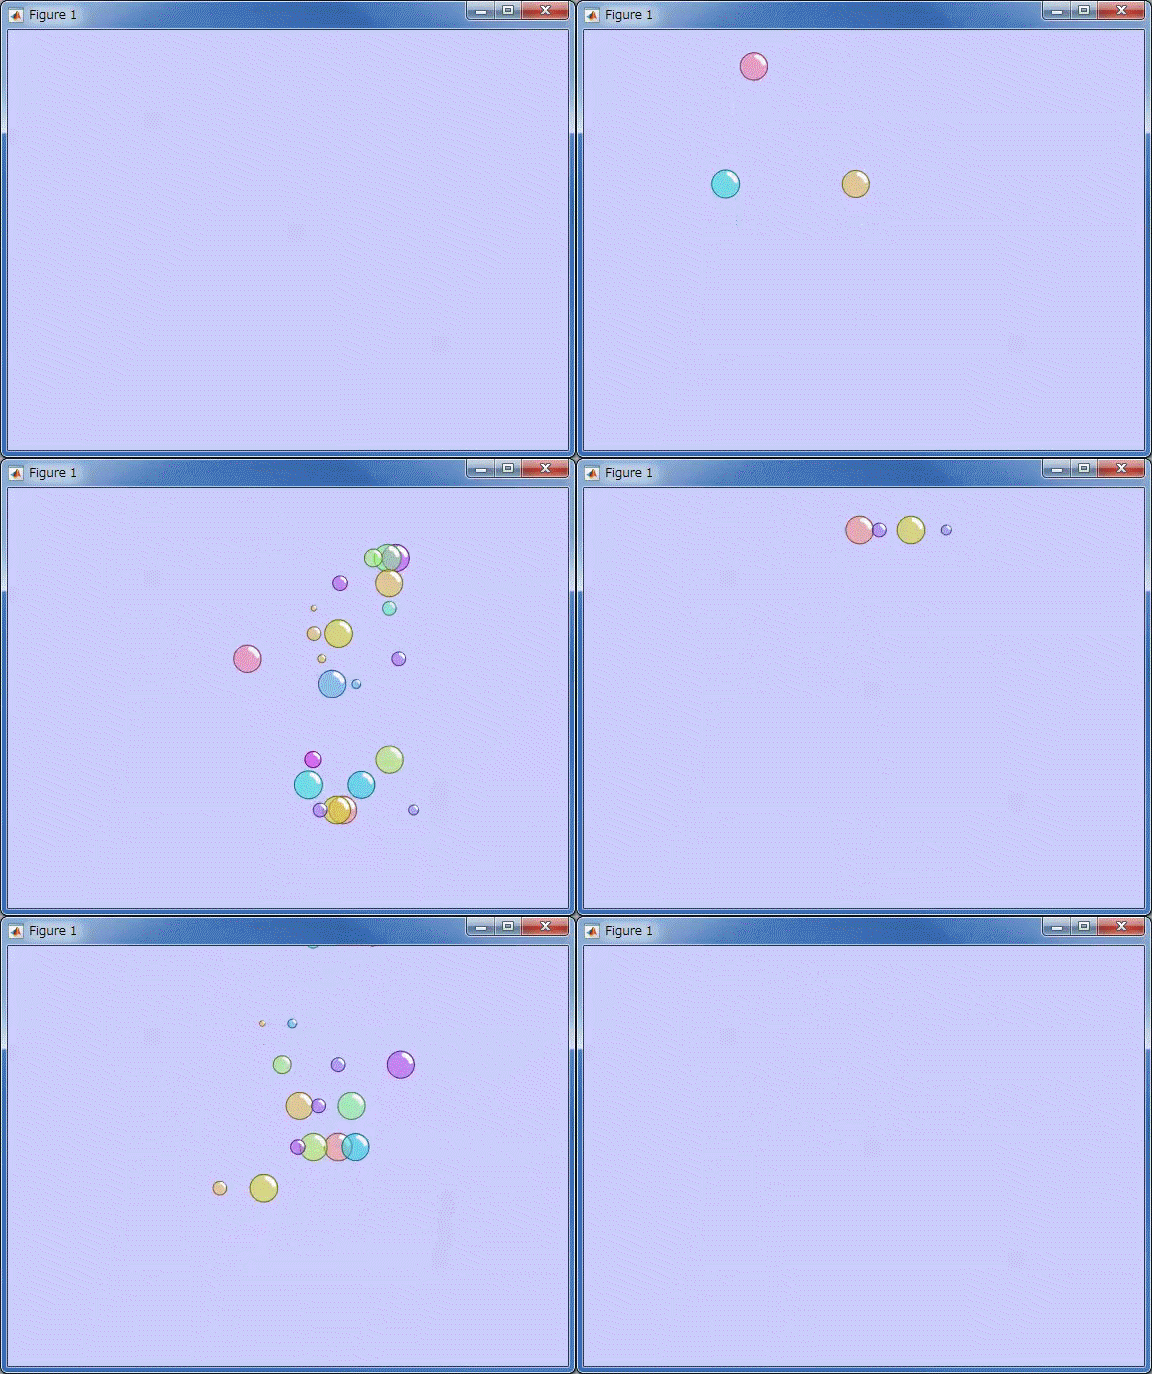
Animating mathematical functions
Jiro‘s Pick this week is Plot Gui 2d by Silas Henderson.
This entry is one of many interactive apps that Silas has created, and I had been quite intrigued by many of his entries. I chose to highlight “Plot GUI 2d” because of its simple, but useful application for teaching mathematical concepts. Visualization helps students understand concepts, and animation increases that understanding.
Silas includes a YouTube video showing the app in action, so I will simply reference it here.
https://www.youtube.com/embed/eGxlSe3YKwg
A few highlights regarding the code:
- Silas uses local functions in his script. This is a relatively new feature introduced in R2016b, so I’m happy to see that being used.
- He uses “KeyPressFcn” property of the figure to capture key presses, which control the zooming and panning of the graph.
- He animates the lines by changing the XData and YData properties of the line objects, instead of re-plotting the lines. This is the recommended way of doing efficient animation. animatedline is another feature that could be useful.
I have one suggestion for Silas. He wrote this using a script, with a global variable to be shared amongst some of his local functions. For such purpose, I prefer using a function, with nested functions. When you do that, the life cycle of the app is with the figure, so it will continue to work so long as the figure is open, even if you do a ” clear all ” in the command line.
Comments
Give it a try and let us know what you think here or leave a comment for Silas.
- Category:
- Picks
 Cleve’s Corner: Cleve Moler on Mathematics and Computing
 The MATLAB Blog
 Guy on Simulink
 MATLAB Community
 Artificial Intelligence
 Developer Zone
 Stuart’s MATLAB Videos
 Behind the Headlines
 File Exchange Pick of the Week
 Hans on IoT
 Student Lounge
 MATLAB ユーザーコミュニティー
 Startups, Accelerators, & Entrepreneurs
 Autonomous Systems
 Quantitative Finance
 MATLAB Graphics and App Building


Comments
To leave a comment, please click here to sign in to your MathWorks Account or create a new one.