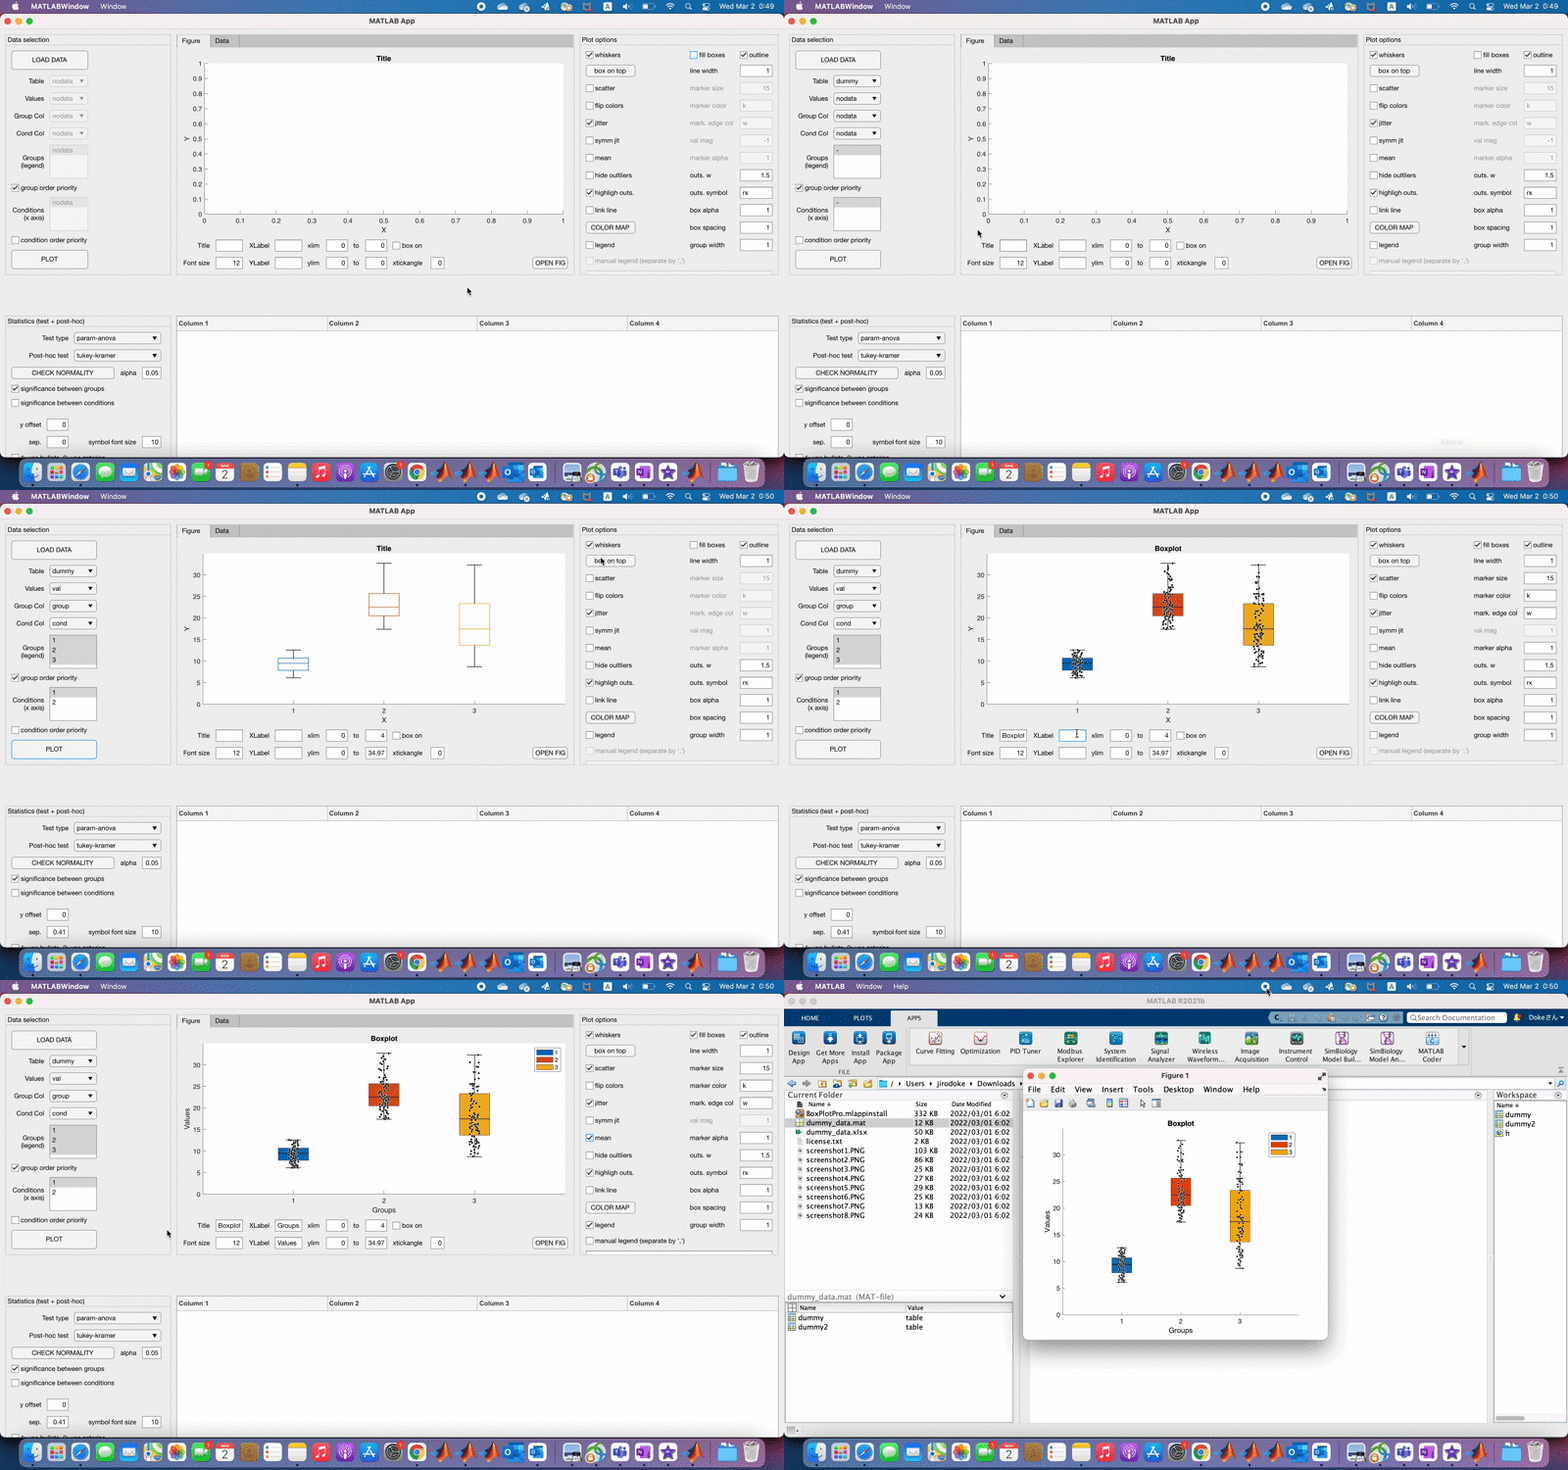
I'm a big fan of apps, since using apps simplifies tasks for common use cases and increases efficiency. As you may know, many MATLAB products come with Apps and Live Editor Tasks to help automate common tasks. While Apps are self-contained applications that launch windows of their own, Live Editor Tasks exist within live scripts and can be used within a larger workflow. BoxPlotPro by Carlos is an app to assist in creating boxplots. It lets you bring in table data from files, pick out data to plot, customize variety of options, compute some statistics, and more! You can "export" the plot as a separate figure window for further customization. Here's the app in action.
This is quite a comprehensive app. As there are always room for improvement in anything in life, I have a couple of enhancement requests.
- You have to click "PLOT" to have the plot options reflected. It would be nice if the graph updated immediately after an option is changed.
- In addition to creating a separate figure window, it would be nice to have an option to generate MATLAB code that would recreate the visualization. This way, one can embed the code into a larger program.
Thank you, Carlos, for making it easy for people to create custom box plots!
Comments
Let us know what you think here or leave a comment for Carlos.

 Cleve’s Corner: Cleve Moler on Mathematics and Computing
 The MATLAB Blog
 Guy on Simulink
 MATLAB Community
 Artificial Intelligence
 Developer Zone
 Stuart’s MATLAB Videos
 Behind the Headlines
 File Exchange Pick of the Week
 Hans on IoT
 Student Lounge
 MATLAB ユーザーコミュニティー
 Startups, Accelerators, & Entrepreneurs
 Autonomous Systems
 Quantitative Finance
 MATLAB Graphics and App Building


Comments
To leave a comment, please click here to sign in to your MathWorks Account or create a new one.