
New in MATLAB R2017b: The Simulation Manager
MATLAB R2017b has recently been released. For this first post about R2017b, I want to highlight a feature that I think most of you will find very useful: The Simulation Manager
The Simulation Manager makes your life a lot easier when using the parsim function, released in R2017a. It has been added in R2017b to help visualizing the progress of your simulations, and to conveniently access results and diagnostics.
Note: If you are not familiar with the parsim function, I recommend going through this past blog post to learn more about it.
Launching the Simulation Manager
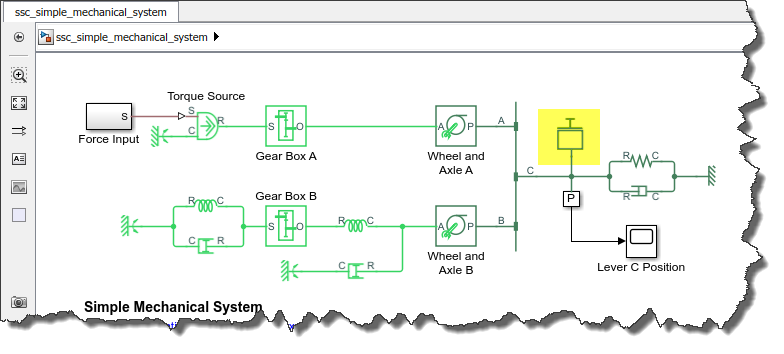
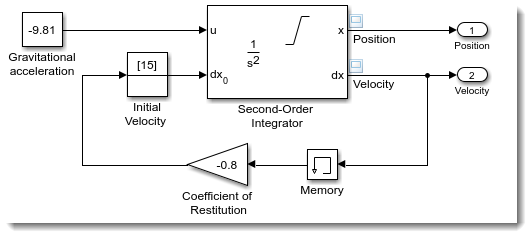
Let's begin by setting an example: I will simulate this simple mechanical system 10 times, with different values for the Mass block highlighted in yellow:
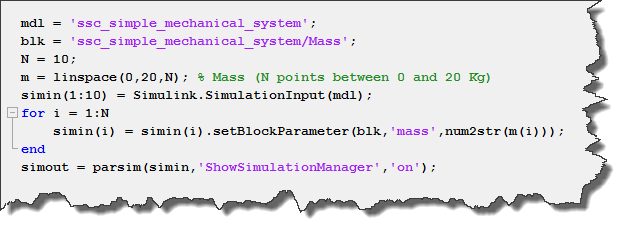
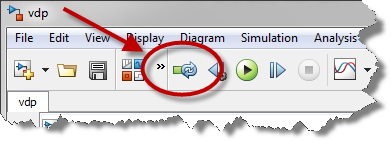
To run those simulations, I create an array of 10 Simulink.SimulationInput objects. For each of them, I use the setBlockParameter method to specify a different value for the Mass block. Then I pass this array to parsim, with the new ShowSimulationManager option set to on.
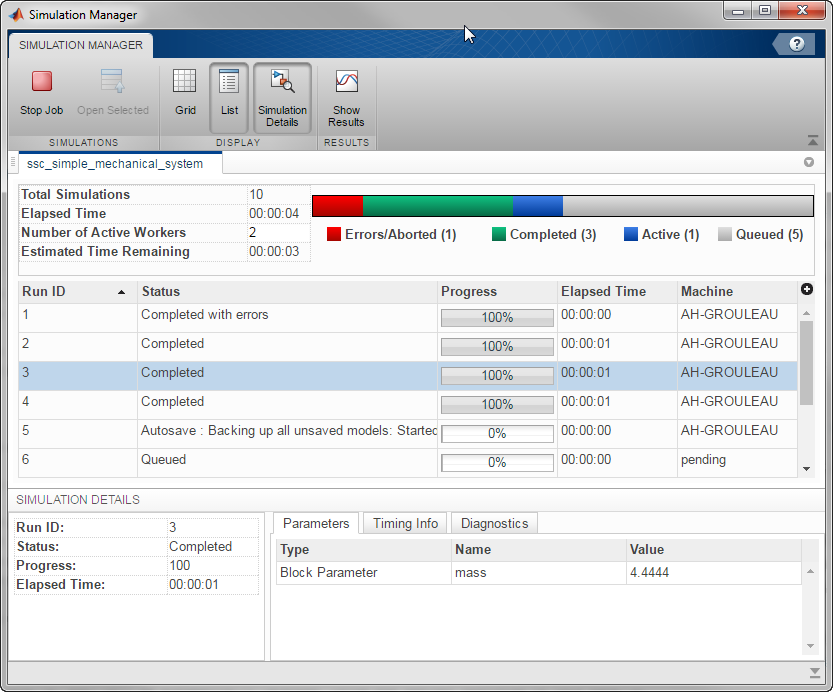
and the Simulation Manager window opens:
Progress
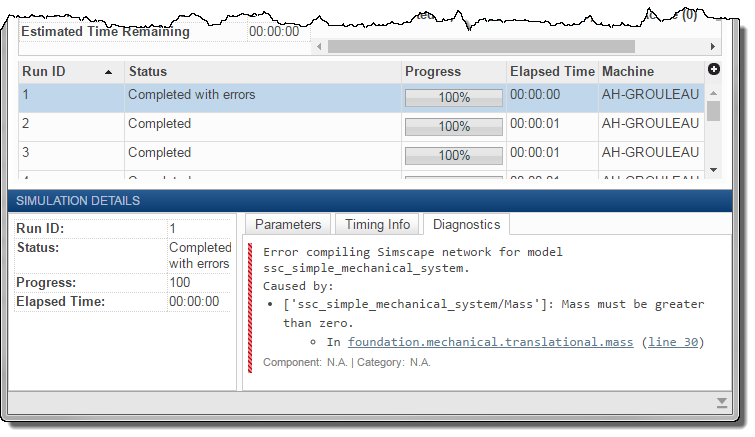
The first thing you will notice is the progress of each simulation. For each run, you can see if it is active, completed, or got an error.
When selecting one run, you can see the list of parameters specific to this run, time info and diagnostics in the Simulation Details pane.
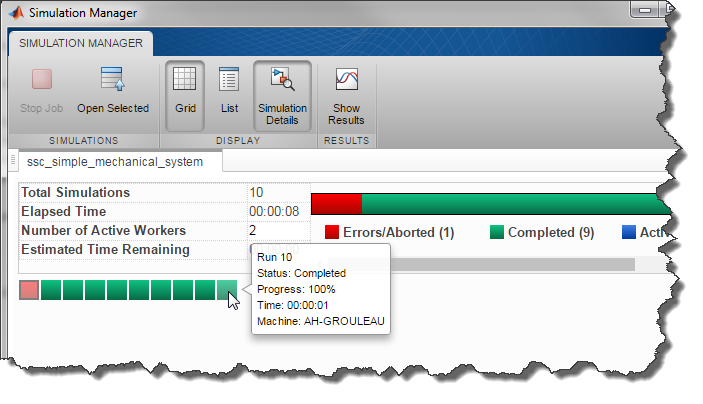
If you have a large number of runs, you probably want to try the Grid view instead of the default List view. This will allow you to get a big picture on the success of all your runs more easily.
One convenient thing to note: If you click the Stop Job button, parsim will return the results for already completed runs. This is more convenient than hitting Ctrl+C, which would have caused you to lose all the results from the job.
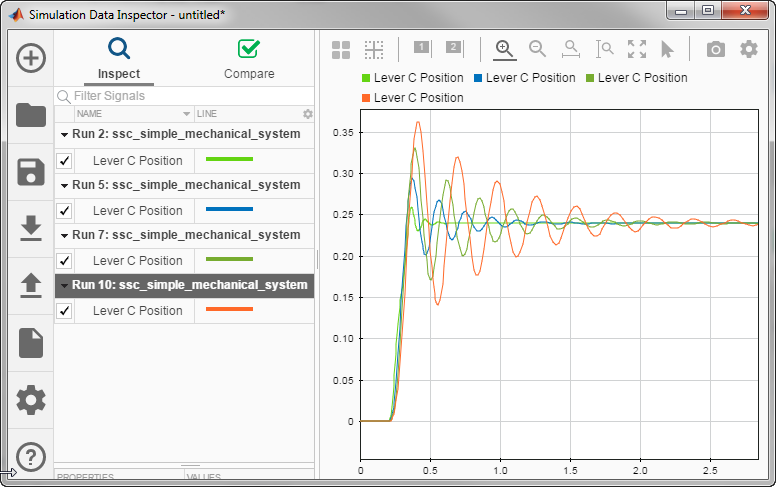
Viewing Results
When you are ready to visualize and compare results, the Show Results button will launch the Simulation Data Inspector for the selected runs (You can use Ctrl+click to select multiple runs). Notice how the Simulation Data Inspector has been revamped in R2017b, more on that in another blog post.
Diagnosing Errors
In this example, the Diagnostics tab help me quickly see that the first simulation failed because the Mass value I specified is zero, which is not allowed. I like how the diagnostic is displayed with the same look and feel as the Diagnostic Viewer.
My Favorite Thing!
Now it's time to talk about my favorite feature of the Simulation Manager: Open Selected.

Anybody who tried to debug errors happening on a remote cluster will probably agree that this can be challenging. Since the parallel workers have no user interface, getting information out of there can be tricky. Debugging in a local MATLAB session is significantly easier.
This is what the Open Selected button does. It opens the model and configures your local MATLAB session like the parallel worker for the selected run. This allows you to add Scopes, log more data, do whatever you typically do while debugging models.
Now it's your turn
Give a try at the Simulation Manager and let us know how you like it.


评论
要发表评论,请点击 此处 登录到您的 MathWorks 帐户或创建一个新帐户。