
MATLAB Basemap Data (R2017b)
Jiro‘s pick this week is MATLAB Basemap Data by MathWorks Mapping Team.
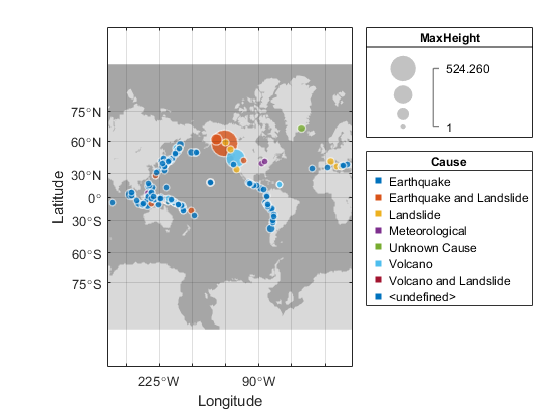
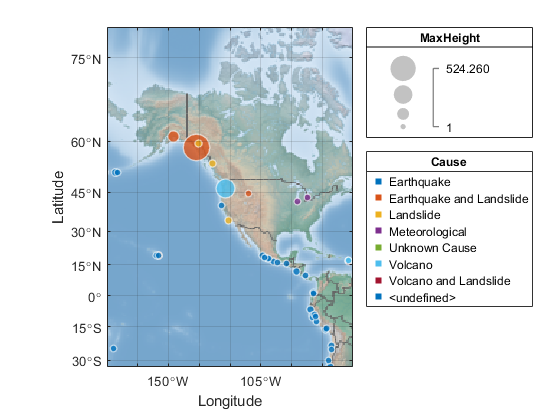
In the new R2017b release, there is a new interactive geographic function called geobubble which displays bubbles at geographic locations, with the size and color representing other parameters.
tsunamis = readtable('tsunamis.xlsx');
tsunamis.Cause = categorical(tsunamis.Cause);
gb = geobubble(tsunamis,'Latitude','Longitude', ...
    'SizeVariable','MaxHeight','ColorVariable','Cause')
gb =
  GeographicBubbleChart with properties:

              Basemap: 'darkwater'
            MapLayout: 'normal'
          SourceTable: [162×20 table]
     LatitudeVariable: 'Latitude'
    LongitudeVariable: 'Longitude'
         SizeVariable: 'MaxHeight'
        ColorVariable: 'Cause'

  Use GET to show all properties
We can focus on a particular area, for example North America, with geolimits.
geolimits([10 65],[-180 -60])
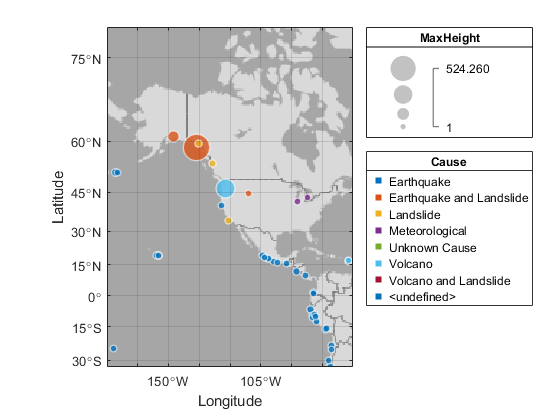
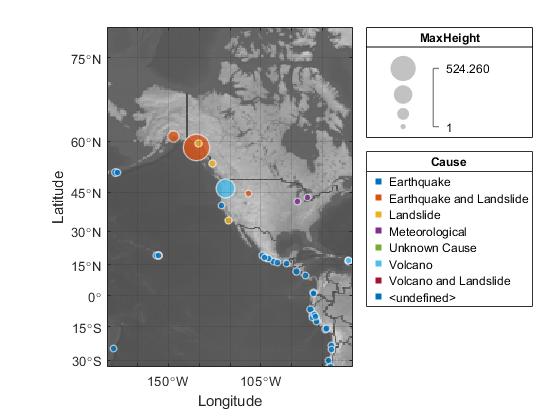
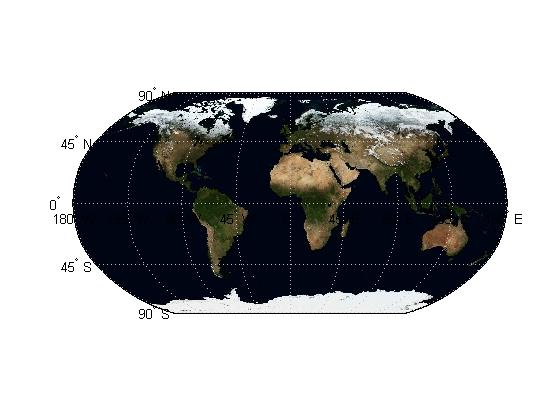
The background image you see is the basemap. By default, the basemap you’re seeing here is called “darkwater” and is included with the product. You can change the Basemap property to five other maps: grayland, bluegreen, colorterrain, grayterrain, landcover. These maps are automatically accessed over the Internet. For those with no or low Internet connection, they can download an offline version of the maps.
grayland
gb.Basemap = 'grayland';
pause(2)
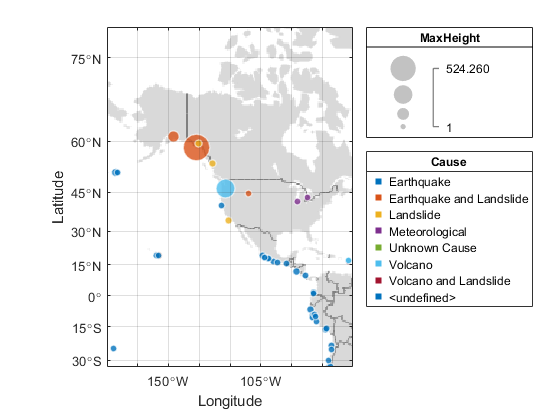
bluegreen
gb.Basemap = 'bluegreen';
pause(2)
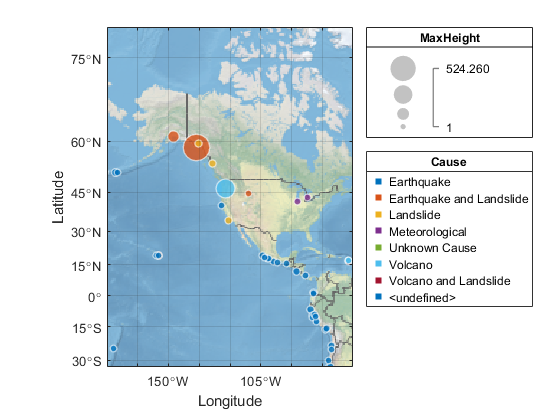
colorterrain
gb.Basemap = 'colorterrain';
pause(2)
grayterrain
gb.Basemap = 'grayterrain';
pause(2)
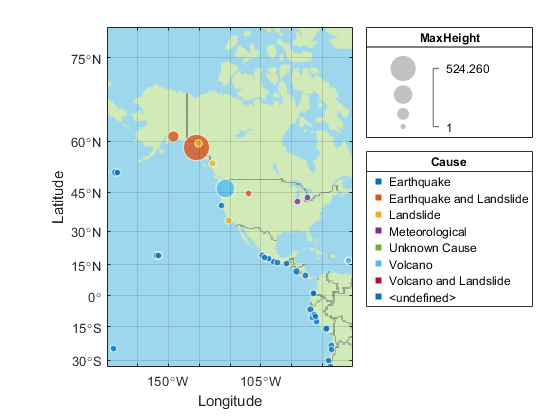
landcover
gb.Basemap = 'landcover';
pause(2)
EDIT (to illustrate the exploratory nature of geobubble, as mentioned by Rob):
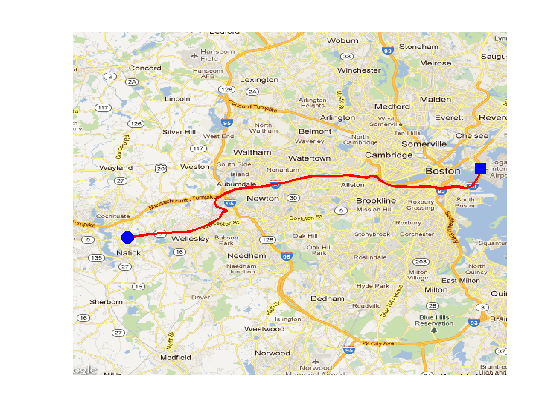
One of the use cases for geobubble is interactive exploration. For example, I can zoom in with my mouse to see a particular location in greater detail.
R2017b
There are plenty of new, great features in the new R2017b. Take a look at what’s new.
Comments
Give it a try and let us know what you think here or leave a comment for the MathWorks Mapping Team.
- Category:
- Picks


Comments
To leave a comment, please click here to sign in to your MathWorks Account or create a new one.