
A couple of my favorite new Image Processing Toolbox functions
In July, 2016, I selected Philip Kollmansberger’s useful File Exchange contribution Skeleton3D as the Pick of the Week. I’d like to revisit that particular blog post today, if I may. For those of you who don’t yet have access to R2018a, Phillip’s contribution is still perhaps your best option for skeletonizing volumetric imagery. But a new function added to the Image Processing Toolbox in the current release (that is, R2018a) gives you provides an alternative. In the Release Notes documenting modifications to the Toolbox, we learn that there is a new function called bwskel that supports skeletonization of 2D and 3D images. This is big!
In light of this new function, it is interesting to take a fresh look at the 3D skeletonization of my earlier Pick.
Consider:
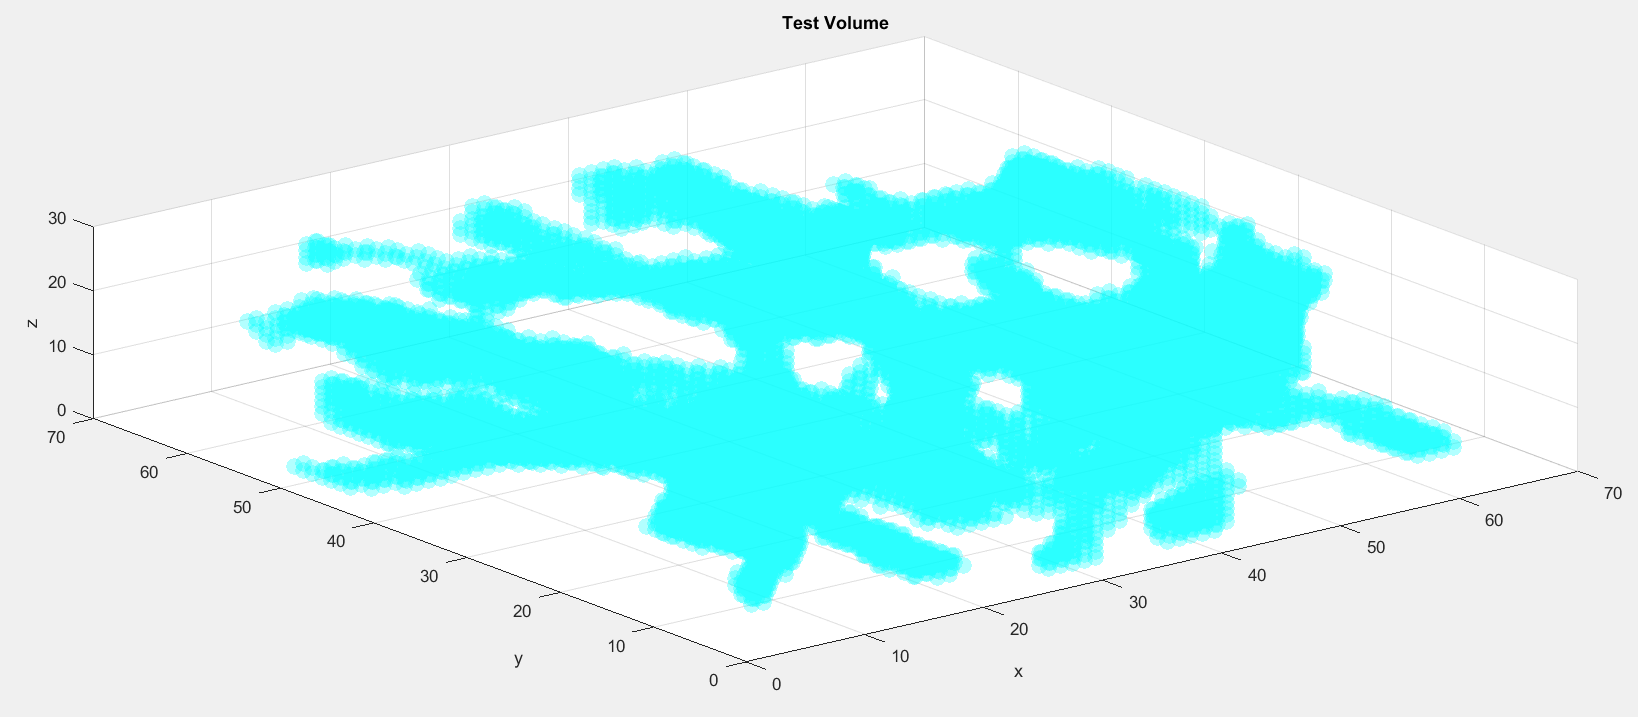
%% Load and display sample 3D data
load spiralVol.mat;
stepSize = 25;
% Detect all spiral points:
inds = find(spiralVol);
% Note the order reversal for x,y (col/row):
[y,x,z] = ind2sub(size(spiralVol),inds);
subplot(2,2,1)
myTitle = sprintf('Full Spiral (Downsampled):\n %i Points',...
    numel(inds));
refreshSpiralVisualization(x,y,z,stepSize,myTitle);
%% First, skeletonization using Skeleton3D (grayscale):
tic
skel = Skeleton3D(spiralVol);
t = toc;
inds = find(skel);
myTitle = sprintf('Using Skeleton3D:\n%i "Skeleton" Points; t = %0.2f sec ',...
    numel(inds),t);
disp('Using Skeleton3D, grayscale')
subplot(2,2,2)
refreshSpiralVisualization(x,y,z,stepSize,myTitle);
hold on
[yskel,xskel,zskel] = ind2sub(size(skel),inds);
scatter3(xskel,yskel,zskel,5,...
    'Marker','o',...
    'MarkerEdgeColor','none',...
    'MarkerFaceColor','r');
%% Next, skeletonization using Skeleton3D (binary):
tic
spiralVolBinary = imbinarize(spiralVol);
skel = Skeleton3D(spiralVolBinary);
t = toc;
inds = find(skel);
myTitle = sprintf('Using Skeleton3D (Binary):\n%i "Skeleton" Points; t = %0.2f sec ',...
    numel(inds),t);
[yskel,xskel,zskel] = ind2sub(size(skel),inds);
subplot(2,2,3)
refreshSpiralVisualization(x,y,z,stepSize,myTitle);
hold on
scatter3(xskel,yskel,zskel,5,...
    'Marker','o',...
    'MarkerEdgeColor','none',...
    'MarkerFaceColor','r');
%% Finally, using |bwskel()| (Binary Only)
tic
spiralVolLogical = imbinarize(spiralVol);
skel = bwskel(spiralVolLogical);
t = toc;
inds = find(skel);
myTitle = sprintf('Using bwskel() (Binary):\n%i "Skeleton" Points; t = %0.2f sec ',...
    numel(inds),t);
[yskel,xskel,zskel] = ind2sub(size(skel),inds);
subplot(2,2,4)
refreshSpiralVisualization(x,y,z,stepSize,myTitle);
hold on
scatter3(xskel,yskel,zskel,5,...
    'Marker','o',...
    'MarkerEdgeColor','none',...
    'MarkerFaceColor','r');
%%
function refreshSpiralVisualization(x,y,z,stepVal,myTitle)
scatter3(x(1:stepVal:end),y(1:stepVal:end),z(1:stepVal:end),0.1,...
    'Marker','o',...
    'MarkerEdgeColor','c',...
   'MarkerFaceAlpha',0.3,...
    'MarkerFaceColor','c');
xlabel('x');
ylabel('y');
zlabel('z');
set(gca,'view',[-26.94  23.6])
title(myTitle)
end

A few things come become apparent looking at these results. First, Skeleton3D() operates without error or warning on grayscale images (upper right axes), but appears to label every nonzero input pixel as a “skeleton” point. More usefully, as suggested by Phillip’s description of the algorithm, the function returns more reasonable skeleton points when operating on a binarization of the input data (lower left axes). However, that calculation took over 25 seconds (including binarization) on my computer. In contrast, bwskel() (lower right) errors (usefully, in my opinion) if you try to operate directly on the grayscale data, and takes less than a second (including binarization) operating on the segmented data. (The outputs of the two functions are not identical, but they both seem reasonable.)
In the 2016 post, I also mentioned that the calculation of blood vessel tortuosity in 3D was compounded by the challenge of determining endpoints of 3D skeletons. That difficulty, too, has fallen by the wayside. The new function bwmorph3 (also in the Image Processing Toolbox) now facilitates the calculation of a half-dozen operations on 3D binary images; fortunately, that list of operations includes endpoint-detection. The net result: if we had a volumetric representation of the vasculature we wanted to evaluate, we could now do so relatively easily.
One final comment: note in the code above that the script contains a local function, or subfunction. The capacity to include subfunctions in scripts was added in R2016b.
As always, I welcome your thoughts and comments.
Published with MATLAB® R2018a
- Category:
- Picks


Comments
To leave a comment, please click here to sign in to your MathWorks Account or create a new one.