
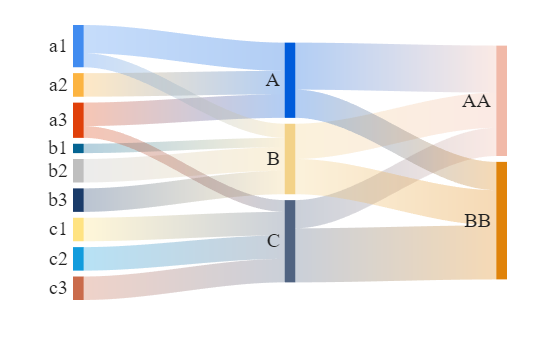
Alluvial flow diagram
Jiro‘s Pick this week is Alluvial flow diagram by Alexander Carmeli.
I give credit to Yair for bringing this entry to my attention. He said, “Such diagrams can be very useful to analyze large categorized timeseries data sets (website traffic, for example).” I was not aware of such visualization, but alluvial diagrams let you visualize change in network structure over time. But the same diagram can be used to visualize how a group of categories map to a different set of categories. Alexander includes an interesting example with his entry. I’ll include it here.
Let’s say that there are four video gamers…
left_labels = {'Arun', 'Kaushik', 'Federico', 'Dave'};
…who play video games during all parts of the day.
right_labels = {'Morning', 'Afternoon', 'Evening'};
We create a matrix of players (row) and part-of-day (column). Each number indicates how many hours a player plays during a particular part of day. For example, in the data below, player 2 plays 3 hours in the morning, 1 hour in the evening, and does not play in the afternoon.
data = [ 2   2   2;
         3   0   1;
         1   2   3;
         4   3   4];
Show how the time played is distributed among gamers and parts of day.
alluvialflow(data, left_labels, right_labels, 'Video gaming hours of four gamers');

Visually, you can immediately tell that Dave plays the most, and players play the least in the afternoon.
Pretty cool, huh?
Community Advisors
One other thing, I’d like to introduce a new page in MATLAB Central, the Community Advisors. If you didn’t know already, Yair is one of our most active community users, and he is also a part of the Community Advisory Board. As you can read from the page, the board members consist of our most active members of the MATLAB Central community, and they help us make MATLAB Central an even better place for our users. This month, I had the honor to meet a few of them in person in Boston. We’re so grateful to have such strong advisors!
Comments
Give the alluvial flow diagram a try and let us know what you think here or leave a comment for Alexander.
- Category:
- Picks


See Also
-

R2020b: swarmchart
Blogs


Comments
To leave a comment, please click here to sign in to your MathWorks Account or create a new one.