
digCircs
Sean‘s pick this week is digcircs by Graham W Griffiths.
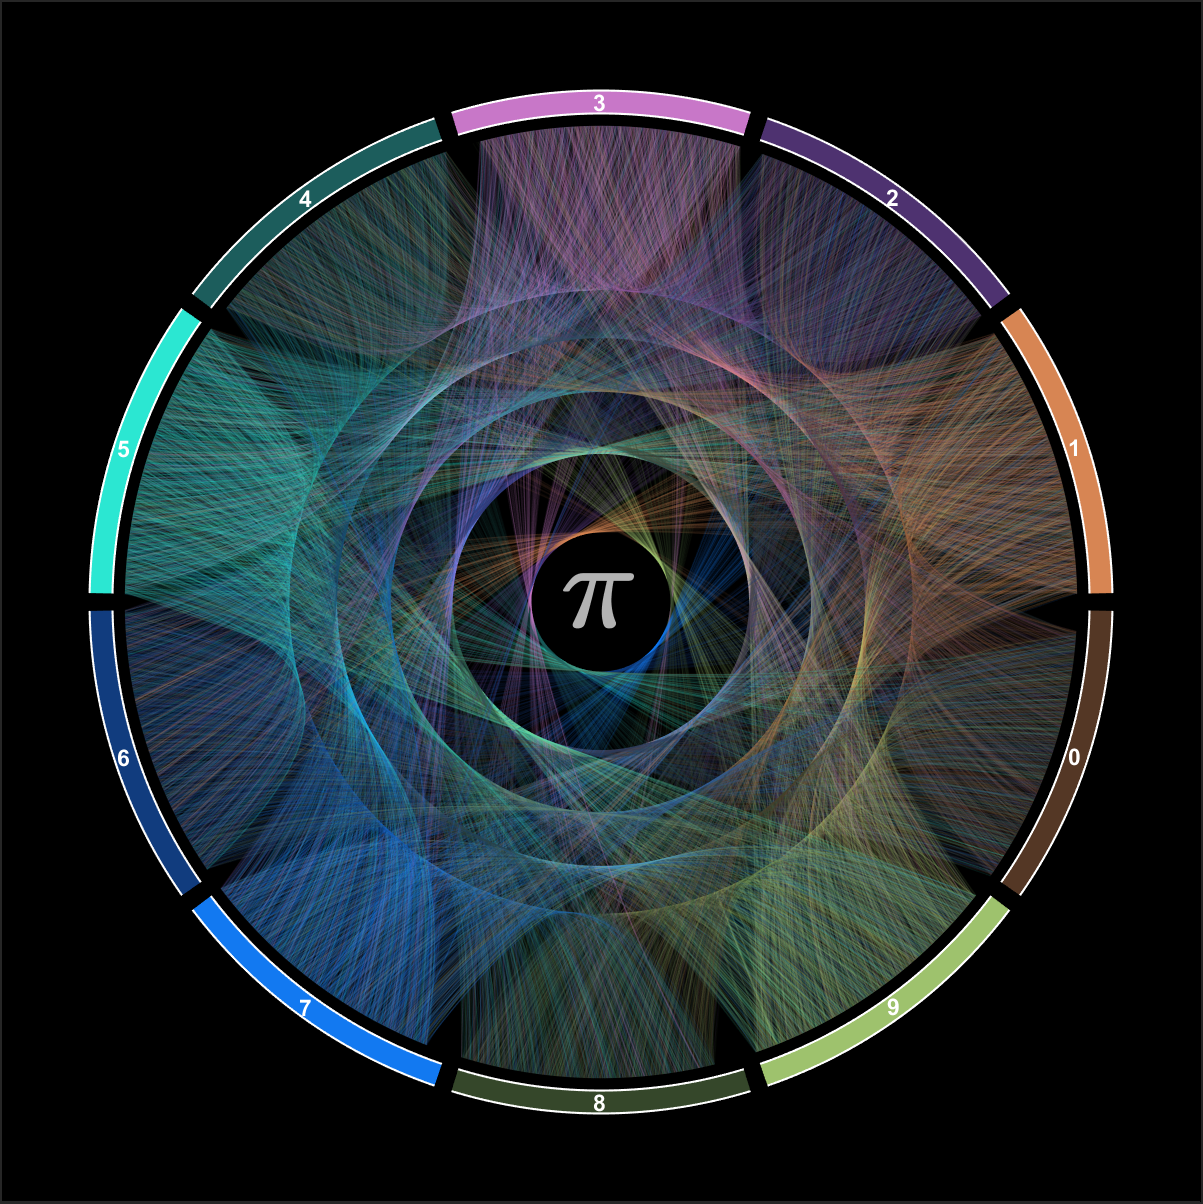
My pick this week is a really cool visualization of the numbers in a sequence. digCircs draws colored parabolic lines between sequential digits in a sequence. Take a look at the first 10000 digits of pi:
or e:

Now there’s actually another reason I picked this. A large portion of my job is staying on top of new features in MATLAB so that I can help customers adopt the technology. As such, I maniacally read the release notes and generally recommend everyone do the same. It’s always exciting to see a new feature in the wild and that is the case with this.
Starting in R2019a, you can use HEX color codes for MATLAB graphics objects. Graham uses this to determine the colors of the lines. Here’s a simple example:
cols1 =  [  "#D78553", ... %  1
            "#4E3270", ... %  2
            "#C877C8", ... %  3
            "#1C5D5C", ... %  4
            "#2BE7D2", ... %  5
            "#113C7E", ... %  6
            "#1279F1", ... %  7
            "#35472A", ... %  8
            "#9EC26D", ... %  9
            "#543725"];    % 10

h = plot(magic(10));
for ii = 1:10
    h(ii).Color = cols1(ii);
end

Comments
Give it a try and let us know what you think here or leave a comment for Graham.
Published with MATLAB® R2020a
- Category:
- Cool feature,
- Picks


See Also
-
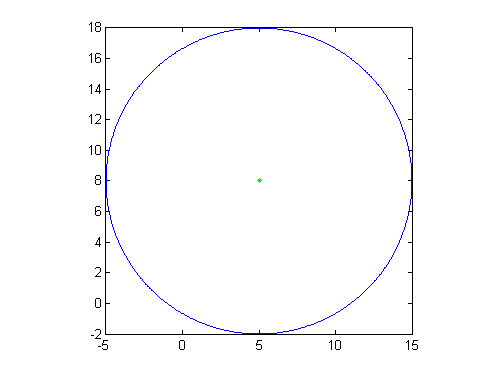
Drawing a Circle
Blogs
-
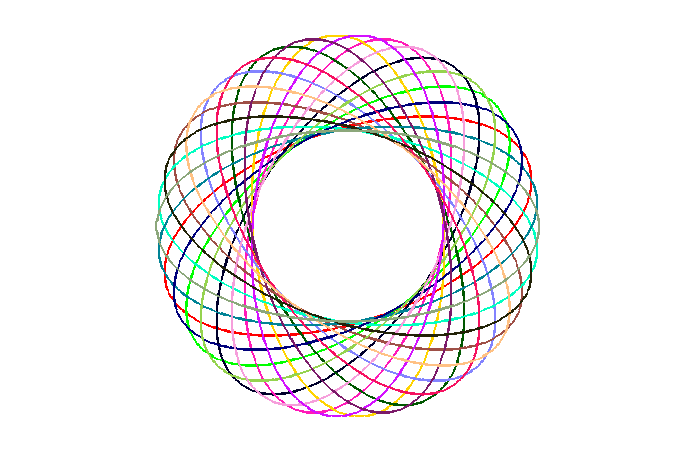
Drawing Ellipses
Blogs


Comments
To leave a comment, please click here to sign in to your MathWorks Account or create a new one.