
Get the Ship Stuck!
Contents
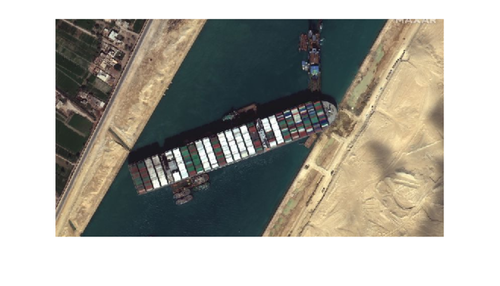
Get the Ship
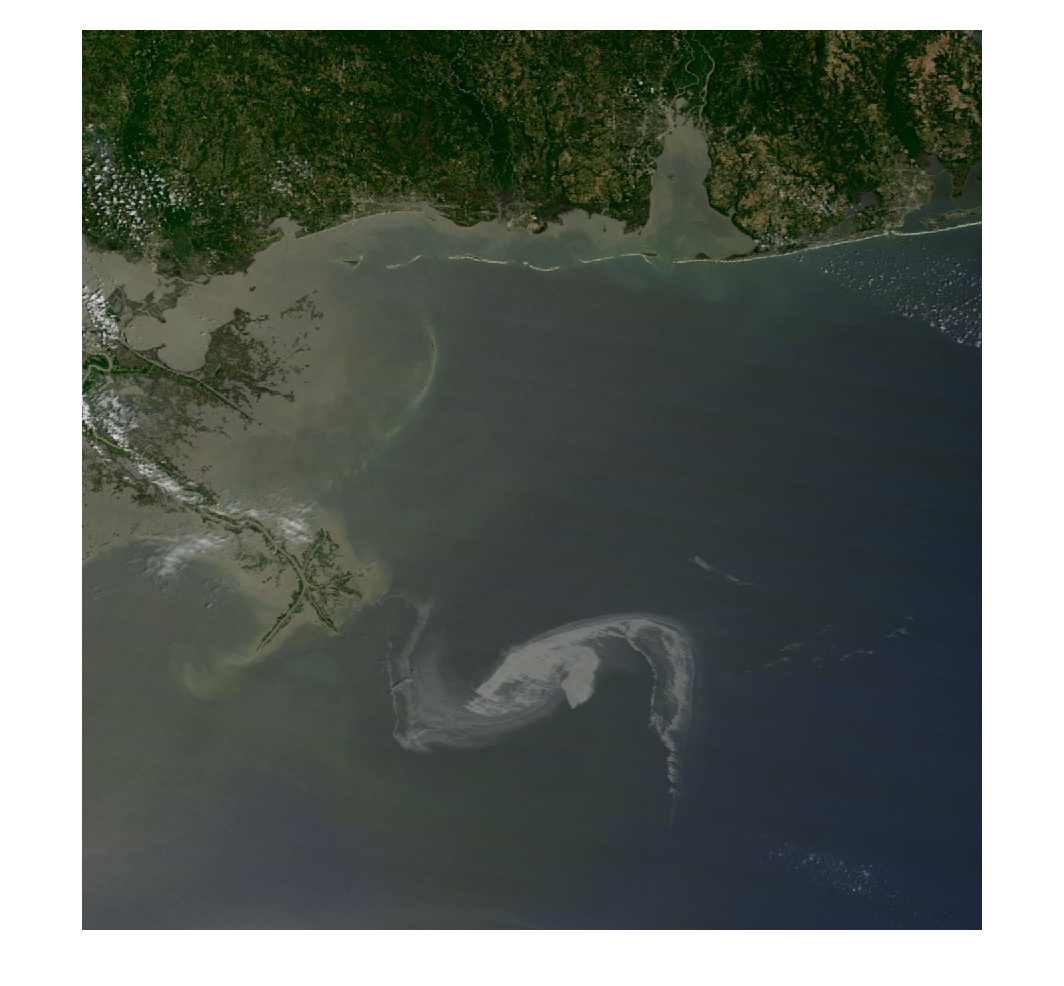
We'll download the ship from a public source and isolate it.
ship = imread('https://e3.365dm.com/21/03/768x432/skynews-ever-given-suez-canal_5320248.jpg?20210327160438');
imshow(ship)
I could probably come up with a way to automatically segment the ship. But I only need to do it once, so I'll just draw the polygon and mask it.
if false
% Draw polygon on border of ship
    p = drawpolygon;
else
    load('p.mat', "p")
    imshow("eg.png")
end

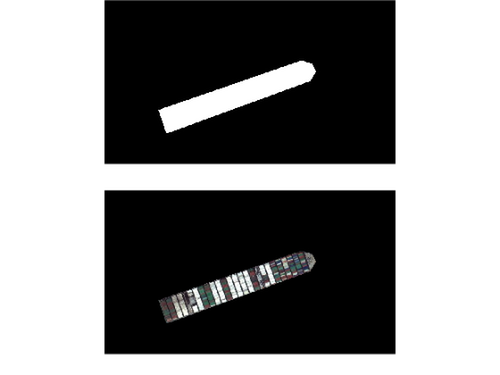
Mask the ship based on the polygon and apply that to the original image.
shipmask = poly2mask(p.Position(:, 1), p.Position(:, 2), height(ship), width(ship));
shipmask = imerode(shipmask, strel("disk", 2));
figure
tiledlayout(2, 1, TileSpacing="compact", Padding="tight")
nexttile
imshow(shipmask)
nexttile
ship = ship.*cast(shipmask, class(ship));
imshow(ship)
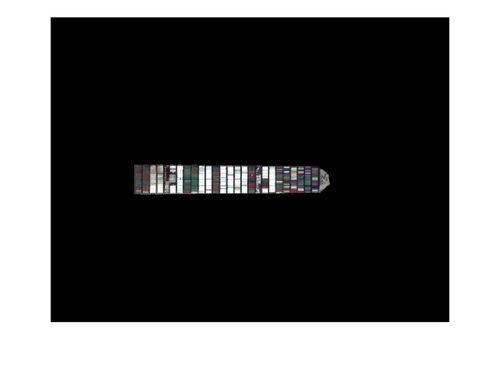
Get the orientation from the ship mask and apply it to the original image.
shipprops = regionprops(shipmask, "Orientation")
shiphorizontal = imrotate(ship, -shipprops.Orientation);
figure
imshow(shiphorizontal)
shipprops =
  struct with fields:

    Orientation: 19.5882
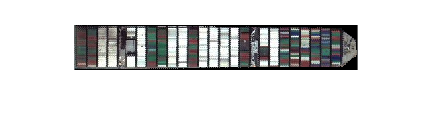
Crop to just the ship
shipbbox = regionprops(logical(shiphorizontal(:, :, 1)), "BoundingBox")
shipthumb = imcrop(shiphorizontal, shipbbox.BoundingBox);
imshow(shipthumb)
shipbbox =
  struct with fields:

    BoundingBox: [181.5000 320.5000 427 67]
Download Lakeside Satellite Imagery
We'll download the satellite imagery from USGS for the region we care about. I'll interactively pick the regional limits for the area I care about.
if false
% Interactively select limits
    w = webmap
    [latlim, lonlim] = wmlimits(w)
else
    latlim = [42.2966508472710 42.3053796253471]
    lonlim = [-71.3800315706306	-71.3639383165411]
end
latlim =
   42.2967   42.3054
lonlim =
  -71.3800  -71.3639
Find the ortho layer and download it for this region.
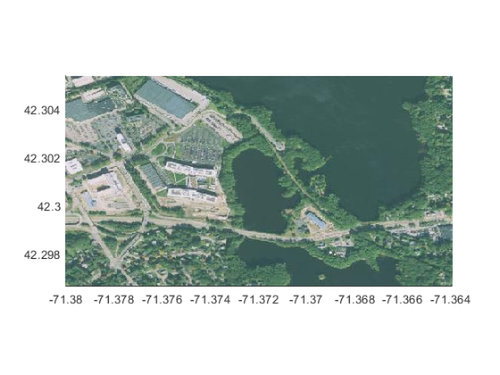
ortho = wmsfind('usgsimageryonly', SearchField='serverurl');
[lakeside, lakesidereference] = wmsread(ortho, latlim=latlim, lonlim=lonlim);
figure
geoshow(lakeside, lakesidereference)
axis tight
Prepare the Ship for "Docking"
I want to put the ship in the little lake between Rt 9 and the railroad track immediately adjacent to MathWorks' Lakeside campus. It looks like a ship orientation of about  will work well.
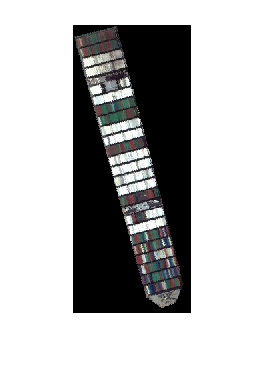
shipn75 = imrotate(shipthumb, -75,'nearest');
figure
imshow(shipn75);
We'll work in meters and need the dimensions of the ship. A quick web search says the length is 399.94m and the beam is 58.8m.
shiplength = 399.94;
shipbeam = 58.8;
At the same time will check the ratio of length to width with that of our image.
props = regionprops(logical(shipn75(:,:,1)), "MajorAxisLength", "MinorAxisLength");
image_shipratio = props.MajorAxisLength/props.MinorAxisLength
actual_shipratio = shiplength/shipbeam
image_shipratio =
    6.7436
actual_shipratio =
    6.8017
I'm happy with that(!) especially considering I just approximated the ship with a drawn polygon.
Now we need to figure out the size of this rotated image in meters. Assuming the ship was a perfect rectangle, we can calculate this size using some trigonometry. It's been awhile since I've done this so I broke out a trusty envelope and tried to remember soh-cah-toa. The equations for image dimensions are:


imgheightm = shipbeam*sind(15)+shiplength*cosd(15)
imgwidthm = shiplength*sind(15)+shipbeam*cosd(15)
imgheightm =
  401.5309
imgwidthm =
  160.3085
Finally, we need to convert the background of the image to NaN so when we plot it shows as transparent. This is where all channels are 0.
shipoverlay = im2double(shipn75);
shipoverlay(repmat(all(~shipoverlay, 3), [1 1 3])) = NaN;
Prepare Lakeside for a Ship
We need to project the satellite imagery from geographic coordinates (lat/lon) to cartesian coordinates (x/y in meters) to overlay the boat on it. We'll use the Mass State Plane coordinate reference system which is optimized for Massachusetts. A quick web search tells me that the code for this coordinate system is 26986.
p = projcrs(26986)
[latgrid, longrid] = geographicGrid(lakesidereference);
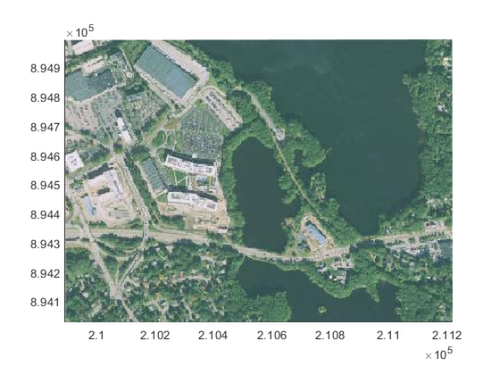
[xgrid, ygrid] = projfwd(p, latgrid, longrid);
figure
mapshow(xgrid,ygrid,lakeside)
axis tight
p =
  projcrs with properties:

                    Name: "NAD83 / Massachusetts Mainland"
           GeographicCRS: [1×1 geocrs]
        ProjectionMethod: "Lambert Conic Conformal (2SP)"
              LengthUnit: "meter"
    ProjectionParameters: [1×1 map.crs.ProjectionParameters]
I'll use a datatip to find the upper left corner of where the boat should go. The live editor gives me the below code to reproduce this.
ax = gca;
chart = ax.Children(1);
datatip(chart, 210495, 894667);
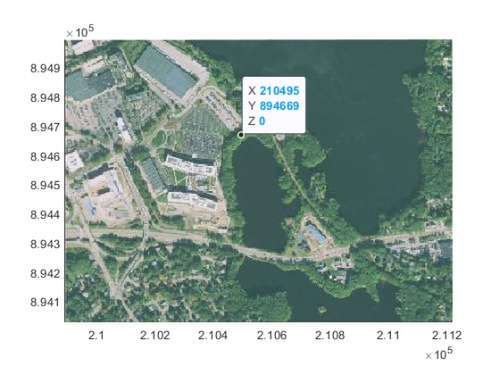
Since the map is now in projected coordinates, the x/y values represent meters. We can create map reference cells that describe the pixel size of the boat image and location which then makes plotting it easy.
xpt = 210495;
ypt = 894667;
mr = maprefcells([xpt xpt+imgwidthm], [ypt-imgheightm ypt], size(shipoverlay, [1 2]), ColumnsStartFrom="north")
mr =
  MapCellsReference with properties:

            XWorldLimits: [210495 210655.308527484]
            YWorldLimits: [894265.469065182 894667]
              RasterSize: [432 177]
    RasterInterpretation: 'cells'
        ColumnsStartFrom: 'north'
           RowsStartFrom: 'west'
      CellExtentInWorldX: 0.905697895390393
      CellExtentInWorldY: 0.929469756523354
    RasterExtentInWorldX: 160.3085274841
    RasterExtentInWorldY: 401.530934818089
        XIntrinsicLimits: [0.5 177.5]
        YIntrinsicLimits: [0.5 432.5]
      TransformationType: 'rectilinear'
    CoordinateSystemType: 'planar'
            ProjectedCRS: []
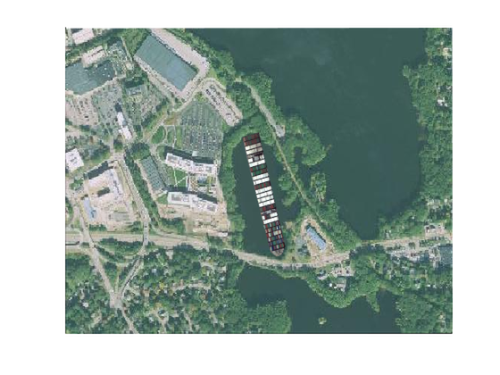
Stick the Ship!
And now we can finally plot the Lakeside image with the Ever Given overlaid on top to scale.
figure
hold on
mapshow(xgrid, ygrid, lakeside)
s = mapshow(zeros(size(shipoverlay, [1 2])), mr, DisplayType="surface", CData=shipoverlay);
axis tight
xticks([])
yticks([])
- Category:
- Picks


Comments
To leave a comment, please click here to sign in to your MathWorks Account or create a new one.