
Animation Playback Controls in Live Scripts (R2021a)
I chose this animation example to highlight one of my favorite new features of R2021a, animation playback controls in live scripts. This release has many great new features, and you may actually miss this one if you don't closely read through the Release Notes.
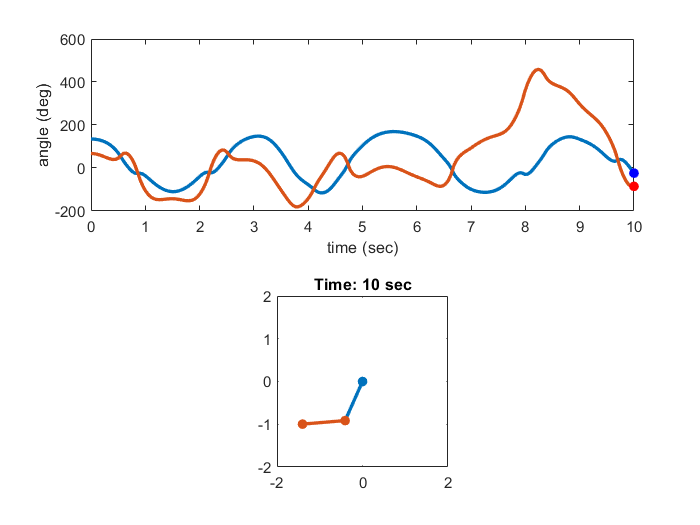
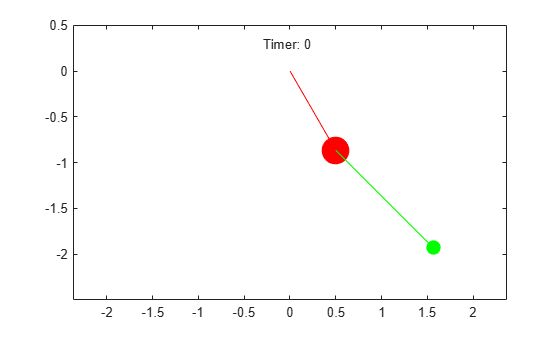
Animations in live scripts had been possible for a few releases now. With R2021a, you can now play back the animation without re-running the code. You get a play control below the plot, with the ability to change the playback speed.
Animation code (adapted from MATLAB Plot Gallery - Animation)
Here is the code for the animation. Take a look at some of the comments; you'll notice that I modified some of the code to use additional new features.
% Parameters and initial conditions
% mass, link length, initial angles, simulation time
m = 1;
L = 1;
theta1 = 3*pi/4;
theta2 = 3*pi/8;
t = linspace(0, 10, 200);
% Solving ODE of a double pendulum
[T,Y] = ode45(@(t, x) double_pendulum(t, x, m, L), ...
t, [theta1, theta2, 0, 0]);
% Calculating joint coordinates for animation purposes
x = [L*sin(Y(:,1)), L*sin(Y(:,1))+L*sin(Y(:,2))];
y = [-L*cos(Y(:,1)), -L*cos(Y(:,1))-L*cos(Y(:,2))];
% Convert radians to degrees
ang = Y(:,1:2)*180/pi;
tiledlayout(2,1) % Introduced in R2019b
nexttile % Introduced in R2019b
plot(T,ang,LineWidth=2) % Name=value syntax introduced in R2021a!!
hold on
hh1(1) = plot(T(1),ang(1,1),Marker=".",MarkerSize=20,Color="b");
hh1(2) = plot(T(1),ang(1,2),Marker=".",MarkerSize=20,Color="r");
xlabel("time (sec)")
ylabel("angle (deg)")
hold off
nexttile
hh2 = plot([0,x(1,1);x(1,1),x(1,2)],[0,y(1,1);y(1,1),y(1,2)], ...
Marker=".",MarkerSize=20,LineWidth=2);
axis equal
axis([-2*L 2*L -2*L 2*L])
ht = title("Time: "+T(1)+" sec"); % String arrays introduced in R2016b
for id = 1:length(T)
set(hh1(1),XData=T(id),YData=ang(id,1))
set(hh1(2),XData=T(id),YData=ang(id,2))
set(hh2(1),XData=[0,x(id,1)],YData=[0,y(id,1)])
set(hh2(2),XData=x(id,:),YData=y(id,:))
set(ht,String="Time: "+T(id)+" sec")
drawnow
end
Run in your browser NOW
Did you know that there's also a new feature in the blogs to run the code right in your browser? Click on the "Run in your browser" button below, and you will see the live script for this blog post open up in an online version of MATLAB. Run the code and you should see the animation playback control after it finishes running.
Helper function for the animation
function dy = double_pendulum(t, y, m, L)
% System of ODEs for a double pendulum (mass m and link length L)
%
% See http://en.wikipedia.org/wiki/Double_pendulum for the differential
% equations
% Copyright 2010 The MathWorks, Inc.
g = 9.81;
theta1 = y(1); % angle 1
theta2 = y(2); % angle 2
p1 = y(3); % momentum
p2 = y(4); % momentum
% The derivatives
dy(1) = 6/(m*L^2) * (2*p1-3*cos(theta1-theta2)*p2) / ...
(16-9*cos(theta1-theta2)^2);
dy(2) = 6/(m*L^2)*(8*p2-3*cos(theta1-theta2)*p1) / ...
(16-9*cos(theta1-theta2)^2);
dy(3) = -1/2*m*L^2*(dy(1)*dy(2)*sin(theta1-theta2)+3*g/L*sin(theta1));
dy(4) = -1/2*m*L^2*(-dy(1)*dy(2)*sin(theta1-theta2)+g/L*sin(theta2));
dy = dy(:);
end
- Category:
- Cool feature,
- Picks


Comments
To leave a comment, please click here to sign in to your MathWorks Account or create a new one.