
Trade Studies with Agentic-AI-powered MBSE

.
In my previous post, I used an agentic AI workflow to create an initial system design for an intergalactic soup factory. That first pass produced a single design based on the RFLP (Requirements-Functional-Logical-Physical) methodology. Getting one architecture out of an agent is nice, but real systems engineering is about choosing between alternatives. So, today I am revisiting the soup factory problem and using a cornerstone technique of decision management: running a trade study.
Inspired by the rapid and significant updates to coding agents since my post back in April, I also tried out a different working style that directly contradicted what I had advocated for back then: I gave the agent a little guidance and let it run without much intervention. I am glad I did this, because it helps validate that my previous approach is still what I would recommend. I have some comments on this towards the end of this article.
This is the first of two posts. This one stops at the static architecture analysis, relying on System Composer and MATLAB. The second post will add implementations in Simulink, Simscape, and Stateflow to those same System Composer architectures with behavioral models, which changes some answers below.
Everything in this post is the study captured at the point in the project where the three architectures existed but no behavior had been modeled yet. The project has moved on since (I’ll share that in the next part of the story). I have deliberately left the baseline numbers as they stood so you can watch how the numbers move across the study.
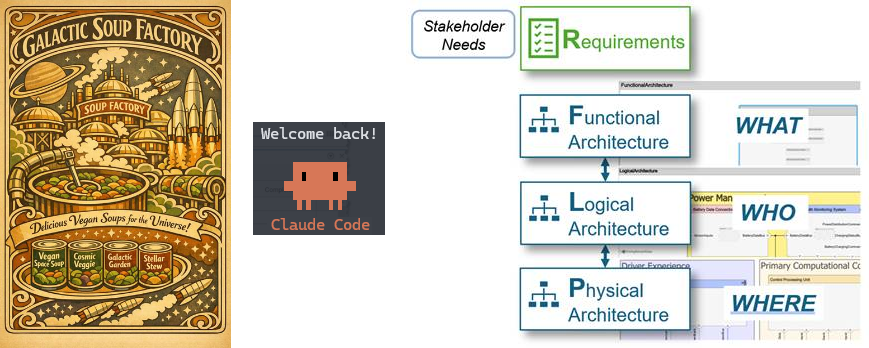
Here’s the obligatory AI-generated image:

The setup
The Simulink Agentic Toolkit now includes skills for Model-Based Systems Engineering (MBSE), so unlike my earlier post, I didn’t have to develop my own to build architectures. I did everything in this post using only the skills shipping in the Agentic Toolkit (Release 2026.08.05).
I started with the same set of stakeholder needs and system requirements as last time: a facility that cooks 8 soup varieties at 200 bowls per hour, ships them across the universe by rocket, runs with at most 5 crew, and fits within budgets for mass, power, cost, and volume.
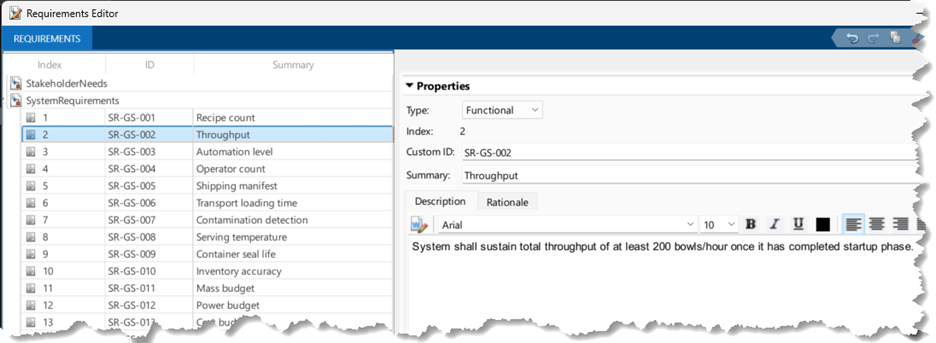
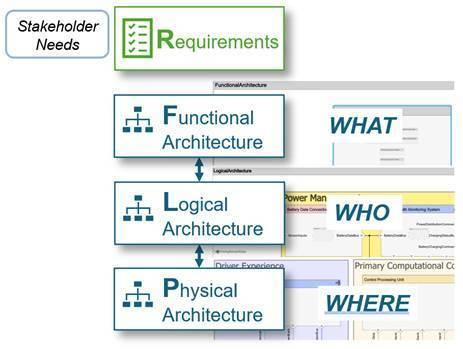
As before, I had the agent use the RFLP methodology to develop the architectures If you don’t recall from the previous post, here’s a reminder on what that methodology looks like:
Three ways to build a soup factory
Based on the functional and logical architectures and the requirements, I asked the agent to develop 3 physical variants that each notionally optimize a different aspect of the requirement space. Here’s what it came up with:
Alternative | Built to maximize | Design concept |
HyperCook | Throughput | Four parallel continuous cook lines |
LeanBroth | Resource-budget margin | Two batch kettles, one prep station, and fewer overall components |
EverSimmer | Mission assurance | Three independent production cells, each a complete prep-cook-quality control-pack chain |
I asked the agent to create a simple diagram of each variant so I can see what it is proposing. It did that very cutely using MATLAB figures.
HyperCook prioritizes throughput with four parallel continuous cook lines.

LeanBroth prioritizes budget margin with two batch kettles and one prep station.

EverSimmer prioritizes robustness: three fully independent production cells, each a complete prep-cook-quality control-pack chain. You can still produce soup even if one or two entire cells fail.
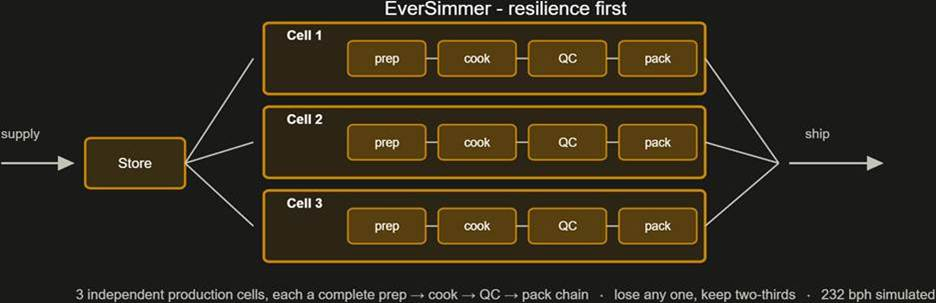
These all looked like reasonable concepts, which was good enough for my purposes to call them validated. So, I had the agent implement them in System Composer architecture models, including data dictionaries, requirements traceability links, and allocations between the functional, logical, and physical models.
One implementation decision I want to point out: these are three separate architecture models, not variant components in one model. The variants differ in topology, hierarchy depth, and component count, and each needs its own allocation set. I reused the interface dictionary and stereotype profile across the three architecture models. You can see all of those here.
Architecture Views
As these architectures grew complex, architecture views became especially useful for understanding the design.
Here’s what the HyperCook physical architecture looks like at the top level:
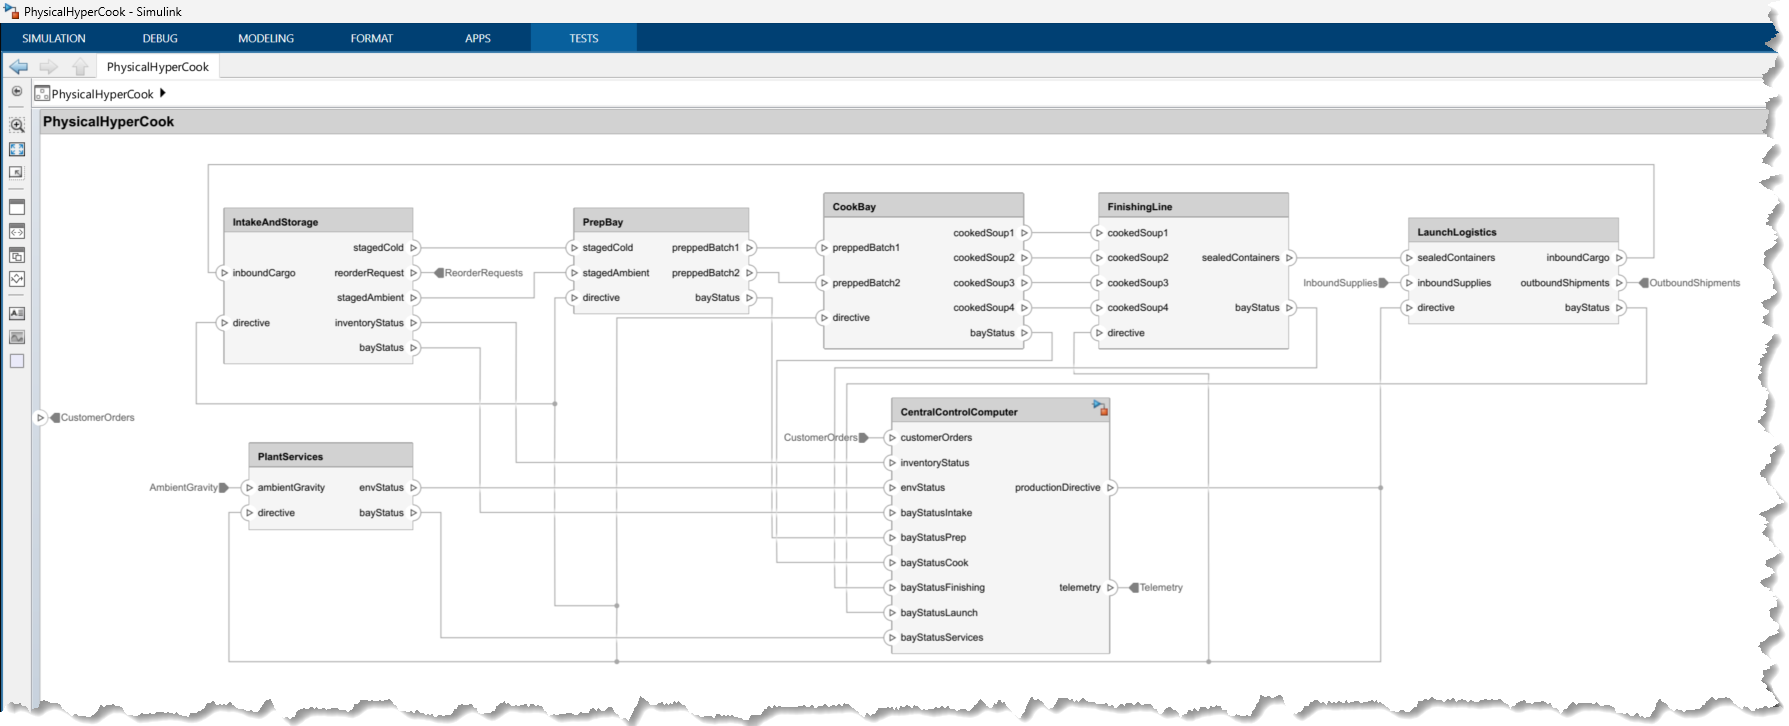
That’s not totally unmanageable, but there are a lot of crossing connections owing to the fact that every component has a connection to the supervisory controller. Here’s a custom view I made that filters that out:
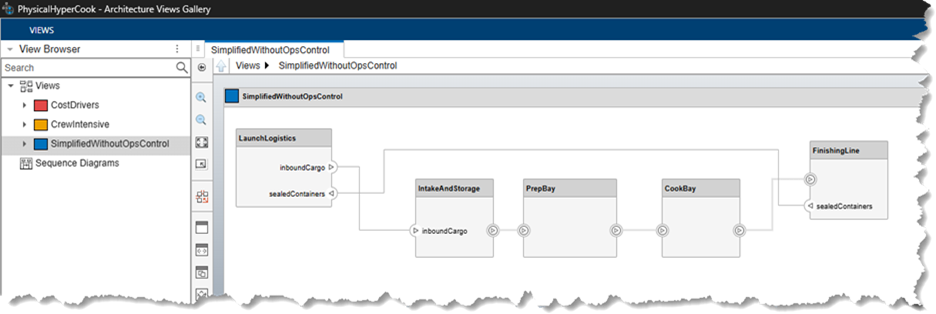
Now that I had 3 variants, it was time to analyze them.
Analyzing Architectures
How do you analyze an architecture? This page in our documentation explains the basics of architecture analysis. As is described in that page, the agent generally followed this workflow:
- Define a profile with a stereotype that describes some properties (ex. cost, mass)
- Apply the profile to the architecture model and add the stereotype to elements of the model (ex. components, interfaces)
- Specify values for the properties on those elements
- Write an analysis function to compute the values needed for the trade study
- Create an instance of the architecture model. This is a tree of elements that correspond to the model hierarchy.
- Run the analysis function and review the results
Next, I’ll walk you through how the agent applied these steps.
Make the architectures measurable
To evaluate these architectures, I need numbers, not just boxes and connections. The best way to do that in System Composer is with stereotypes. A stereotype is a collection of properties that can be applied to design elements such as components and interfaces. Each component in my architectures uses the same stereotype to capture properties like mass, power, cost, throughput capacity, and so on.
I didn’t tell the agent what the properties should be; it came up with those itself.
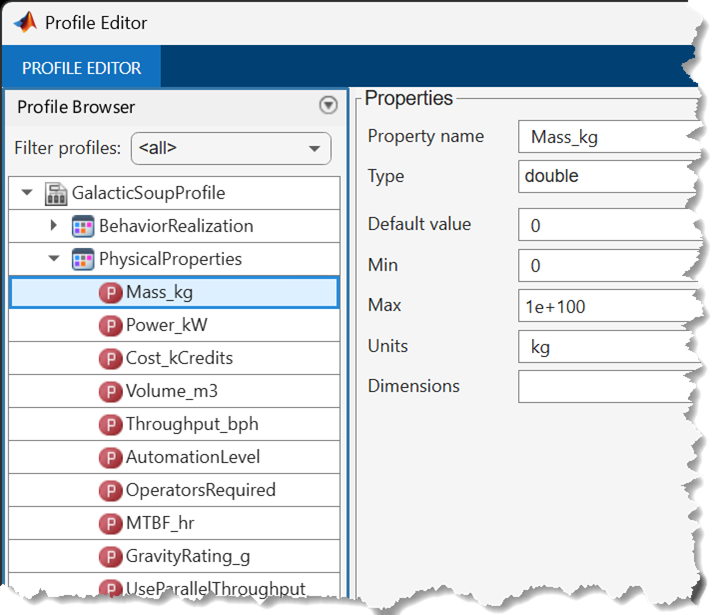
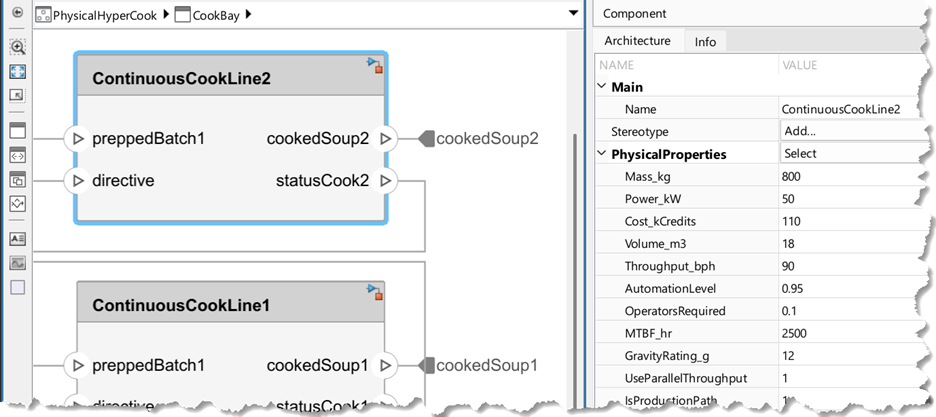
The agent also assigned the values for these properties. I’m not an expert in sizing components for fictional production facilities, so I left those values as whatever the agent made them. Since I let my agent go out to the internet, it was able to poke around the web and find some believable numbers.
Analysis Functions
The mathematical approach for an analysis function depends on the property being analyzed. This documentation page explains a few analysis constructs: Analysis Function Constructs
Here are a few examples from the soup factory:
- Mass, power cost: Things that you can add up, usually called a roll-up analysis. The mass of a component is the sum of the mass of its constituents. You can see in the code below that the analysis function for these roll-up properties iterates through the architecture, summing the property values of each leaf of the architecture from the bottom up (hence “roll-up”):
variants = {'HyperCook','PhysicalHyperCook'; 'LeanBroth','PhysicalLeanBroth'; 'EverSimmer','PhysicalEverSimmer'};
results = struct([]);
for v = 1:size(variants, 1)
vname = variants{v,1};
model = systemcomposer.loadModel(variants{v,2});
instance = instantiate(model.Architecture, 'GalacticSoupProfile', [vname 'Analysis']);
iterate(instance, 'PostOrder', @gsRollup);
r.Variant = vname;
r.Model = variants{v,2};
% Budget sums from top-level children after roll-up
for pn = {'Mass_kg','Power_kW','Cost_kCredits','Volume_m3','OperatorsRequired'}
s = 0;
for c = instance.Components
if c.hasValue([prefix pn{1}])
s = s + c.getValue([prefix pn{1}]);
end
end
r.(pn{1}) = s;
end
function gsRollup(instance, varargin)
%GSROLLUP PostOrder roll-up of additive PhysicalProperties through the hierarchy.
% Composites receive the sum of their children for each additive property.
% Use with: iterate(instance, 'PostOrder', @gsRollup)
prefix = 'GalacticSoupProfile.PhysicalProperties.';
additive = {'Mass_kg', 'Power_kW', 'Cost_kCredits', 'Volume_m3', 'OperatorsRequired'};
for j = 1:numel(additive)
prop = [prefix additive{j}];
if instance.isComponent() && ~isempty(instance.Components) && instance.hasValue(prop)
total = 0;
for child = instance.Components
if child.hasValue(prop)
total = total + child.getValue(prop);
end
end
instance.setValue(prop, total);
end
end
end
- Things that are limited by a minimum capability: Gravity rating is a minimum; the gravity rating of a system is dictated by the weakest gravity rating of its constituents.
% Leaf-based metrics
leaves = gsCollectLeaves(instance);
gravVals = cellfun(@(L) L.getValue([prefix 'GravityRating_g']), leaves);
r.GravityMin = min(gravVals);
- Throughput is a bottleneck calculation. A production line runs no faster than its slowest stage, and parallel stages add. I used this kind of calculation for the throughput of each variant. (That's a lot more code than you want to see in a snippet, you can find it in runVariantAnalysis.m.)
Here’s a summary of the results (each value is followed by the corresponding percentage of the requirement cap that represents):
Metric | HyperCook | LeanBroth | EverSimmer |
Mass, kg Requirement: ≤ 15,000 | 14,320 (95.5% of requirement cap) | 7,570 (50.5%) | 11,120 (74.1%) |
Power, kW Requirement: ≤ 500 | 498 (99.6%) | 239 (47.8%) | 363 (72.6%) |
Cost, kCr Requirement: ≤ 2,000 | 1,980 (99.0%) | 1,070 (53.5%) | 1,905 (95.3%) |
Throughput, bph, Requirement: ≥ 200 | 320 (+60%) | 210 (+5%) | 240 (+20%) |
Performing the trade
All three variants pass the requirements gates, but that was expected since they were derived from the requirements and the agent could easily design it that way. So which is the “best” physical architecture? Time for a trade study!
To make this study, I told the agent to use Multiple Criteria Decision Analysis (MCDA) (sometimes called Multiple Objective Decision Analysis, MODA), which is a weighted decision matrix: score each option per criterion, normalize, weight, sum.
% --- Weighting scenarios ---
scen.Balanced = [0.20 0.10 0.15 0.10 0.10 0.15 0.20];
scen.ThroughputFirst = [0.35 0.05 0.15 0.10 0.05 0.15 0.15];
scen.CostLean = [0.10 0.20 0.35 0.05 0.10 0.10 0.10];
scen.MissionAssurance = [0.10 0.05 0.10 0.10 0.10 0.25 0.30];
scenNames = fieldnames(scen);
scores = zeros(nV, numel(scenNames));
for s = 1:numel(scenNames)
w = scen.(scenNames{s});
assert(abs(sum(w) - 1) < 1e-9, 'Weights must sum to 1');
scores(:,s) = norm * w';
end
Each criterion is min-max normalized across the three variants, so the best design on any criterion scores 1.0 and the worst scores 0.0. Then four weighting scenarios, each summing to 1, stand in for four stakeholders who would each make this decision differently. These weights are numerical stand-ins for opinions; they are not derived from anything.
Scenario | What it prioritizes |
Balanced | No strong preference; throughput and resilience weighted slightly highest |
ThroughputFirst | 35% on throughput margin |
CostLean | 55% combined on cost and resource margin |
MissionAssurance | 55% combined on availability and failure tolerance |
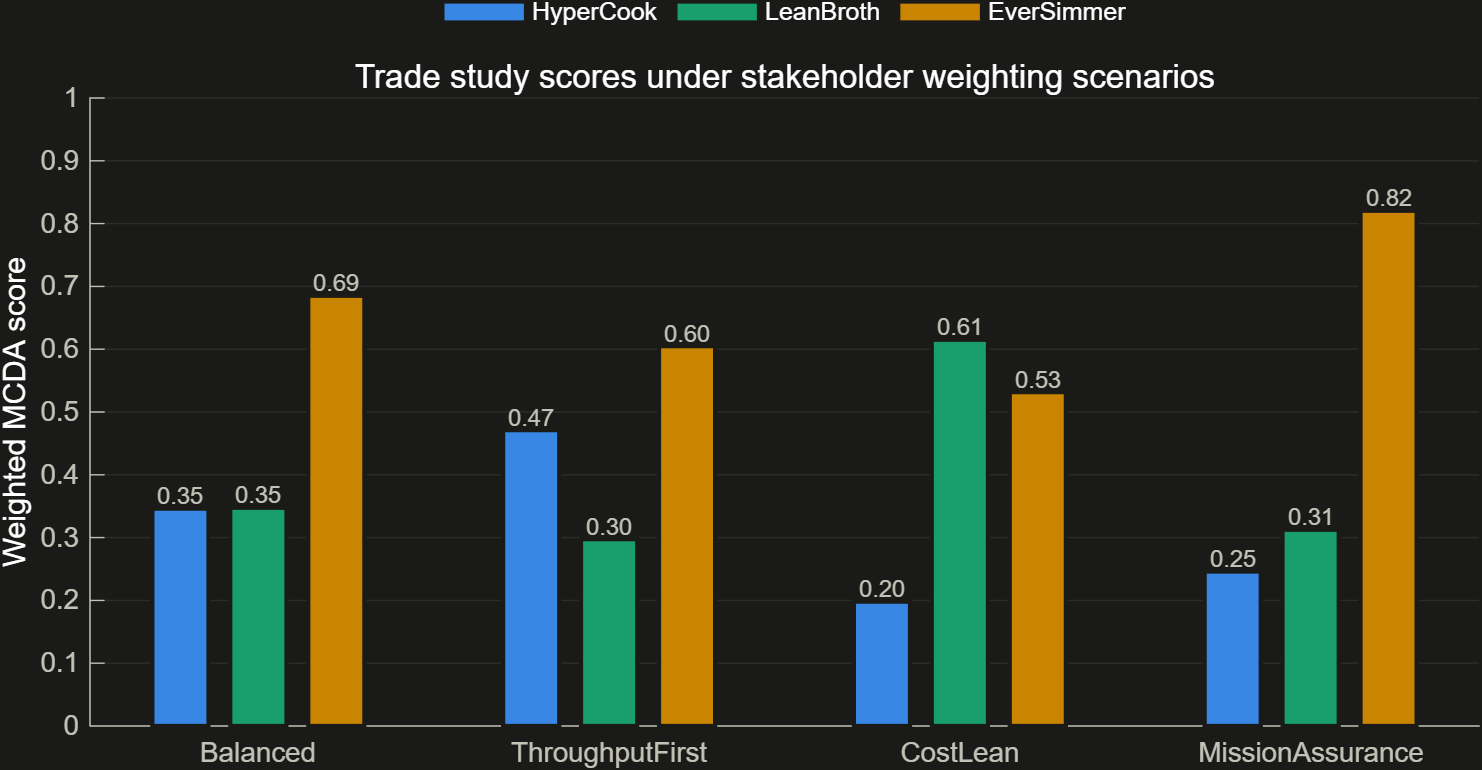
Here's how the variants scored on these scenarios:
Is this just telling me what I wanted to hear?
Maybe? To find out, I tested the weighting schemes. The four scenarios above are designed by the agent, and that can encode biases and guesses. To test that, I drew 5,000 random weightings and counted how many times each variant won to get a sensitivity analysis over the space of plausible stakeholder priorities.
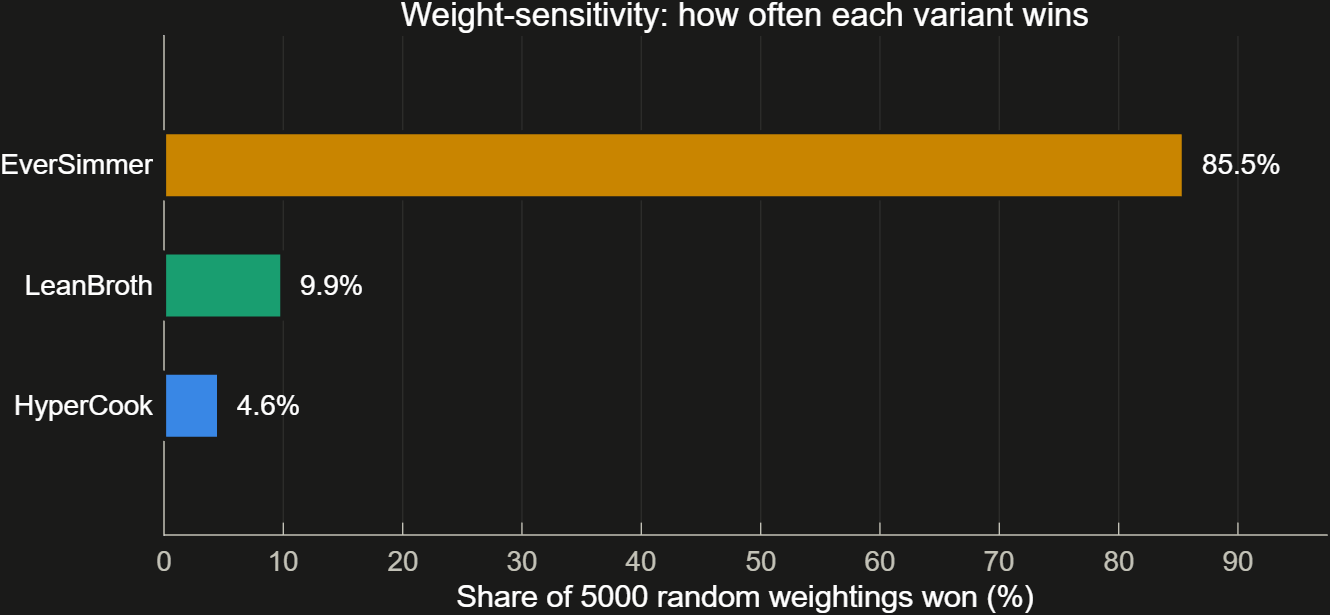
EverSimmer wins in three of four hand-picked scenarios and 85% of the Monte Carlo stakeholder priorities. So based on these study results, it seems that EverSimmer has strength as a design choice.
What this study does not tell you
An analysis is only as good as its stated limits, so here are the ones I would raise first in a review:
- These are point estimates, not distributions. At this early stage of design, the parameter values should have some range associated with them, which would give us distributions.
- Normalization of the criteria is relative to this set of three. These scores compare HyperCook, LeanBroth, and EverSimmer to each other and mean nothing outside that comparison.
- Nothing here has actually simulated. Every number above is a claim on a spec sheet. The roll-up assumes soup flows through the factory with zero losses and nothing ever breaks.
Working with the agent, this time
My April post described a propose-approve-generate-run-confirm loop, with me in the middle of every step. That is not how this project went. With the current generation of agent I described outcomes, and it worked in long autonomous stretches: building models, running simulations, writing and executing its own tests, farming documentation to sub-agents, and committing when things passed. My involvement moved up a level, from approving steps to reviewing artifacts, specifying analysis approaches, and pivoting focus based on my engineering judgment.
That all sounds nice, and it was certainly fun to launch a small army of agents and see work get done so quickly. But this was not painless. The agents produced such a large volume of material so quickly, models, code, documents, etc., that I occasionally felt overwhelmed trying to maintain my orientation and ownership of all of it.
The most important lessons from that mode of working:
Make it write everything down. The decision logs were crucial for remembering and understanding what I asked the agent to do and why. This project grew quickly, and I would have had to start over many times without those documents.
Have the agent work in chunks YOU can manage. The agent, and especially with a cohort of subagents, can churn out huge volumes of material; it doesn’t matter to them. Make it plan and execute in batches that you and your team can handle reviewing.
Stay in the loop at every stage. It’s so tempting to give a little direction and then walk away, but this is not the way to do engineering.
Now it's your turn
The whole project is on GitHub as a runnable reference example: models, requirements, analysis, tests, and the documentation set. You can open the project and open this guided tour.
As I flagged at the top, that gives you the current numbers rather than the baseline ones in this post.
I hope you come back for the next installment when we will add in some dynamics!





댓글
댓글을 남기려면 링크 를 클릭하여 MathWorks 계정에 로그인하거나 계정을 새로 만드십시오.