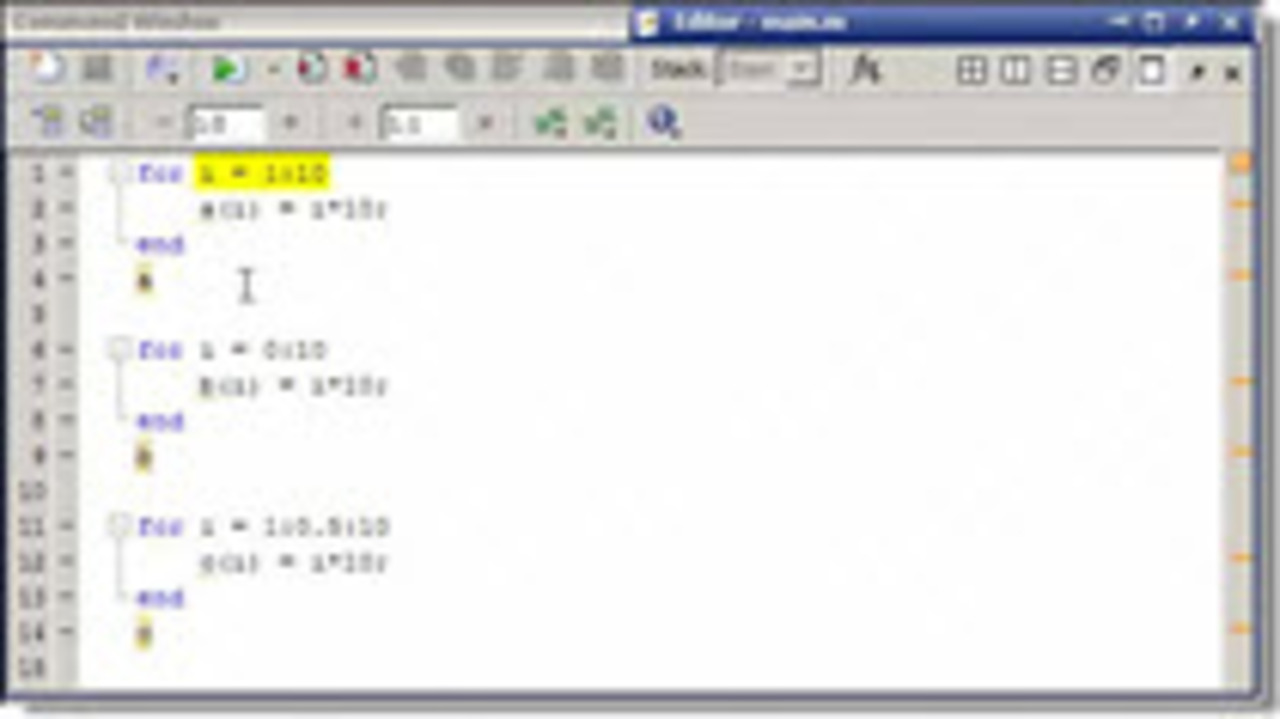
This video shows how to fix common errors in MATLAB when indexing into a vector or matrix in a for loop. if (typeof(playerLoaded) === ‘undefined’) {var playerLoaded = false;}(function… read more >>

This video shows how to fix common errors in MATLAB when indexing into a vector or matrix in a for loop. if (typeof(playerLoaded) === ‘undefined’) {var playerLoaded = false;}(function… read more >>

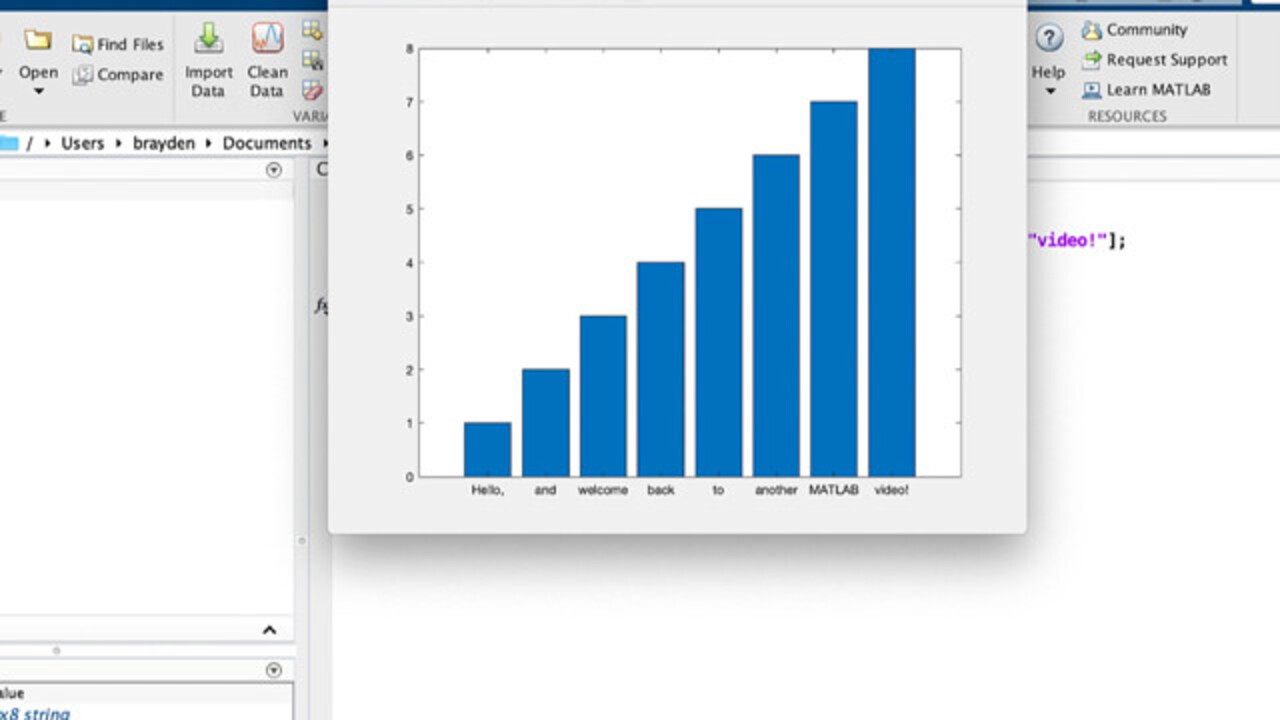
This short video shows how to change the tick labels on a plot. You might want to do this for bar plots, or just a regular plot that you want to customize. if (typeof(playerLoaded) ===… read more >>
Lots of MATLAB functions want strings as inputs. Very often MATLAB users want to use the value of a variable in that string. This video tutorial shows how to do that. if (typeof(playerLoaded)… read more >>
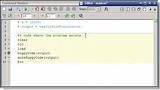
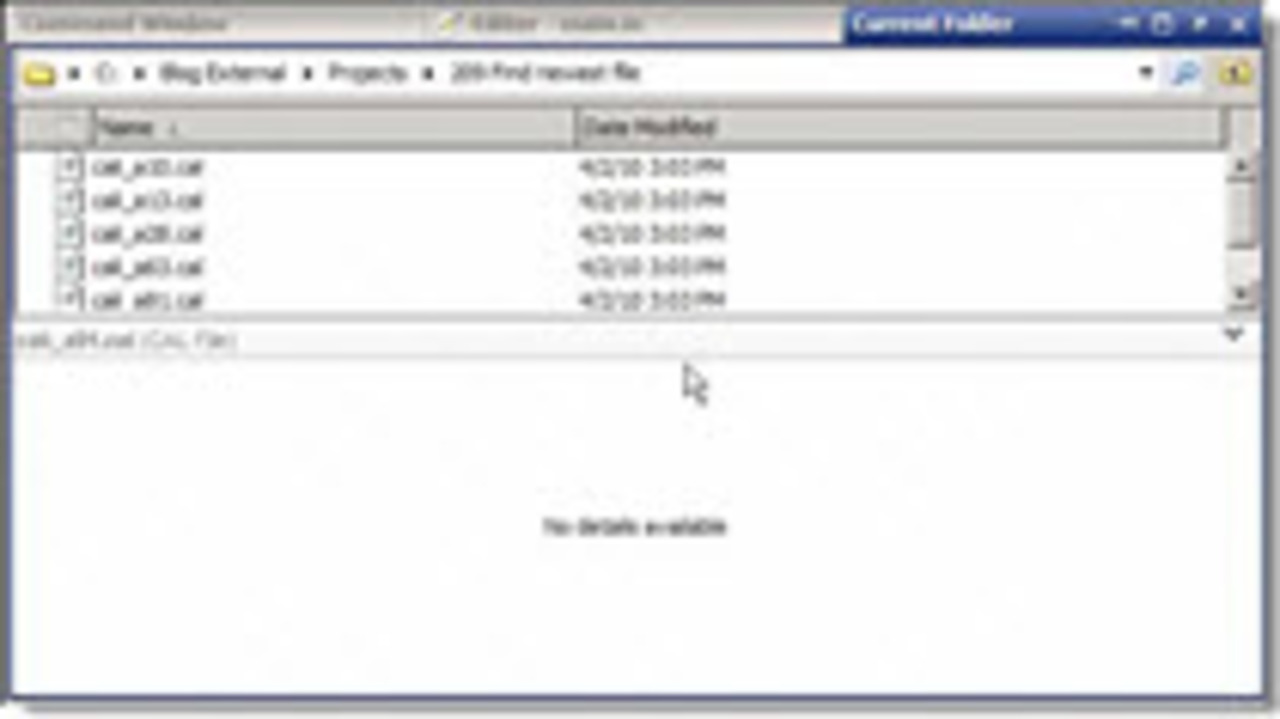
When you have a bug that occurs in a script of function that takes a long time to run, you can use this technique to get to the bug faster in MATLAB. if (typeof(playerLoaded) === ‘undefined’) {var… read more >>
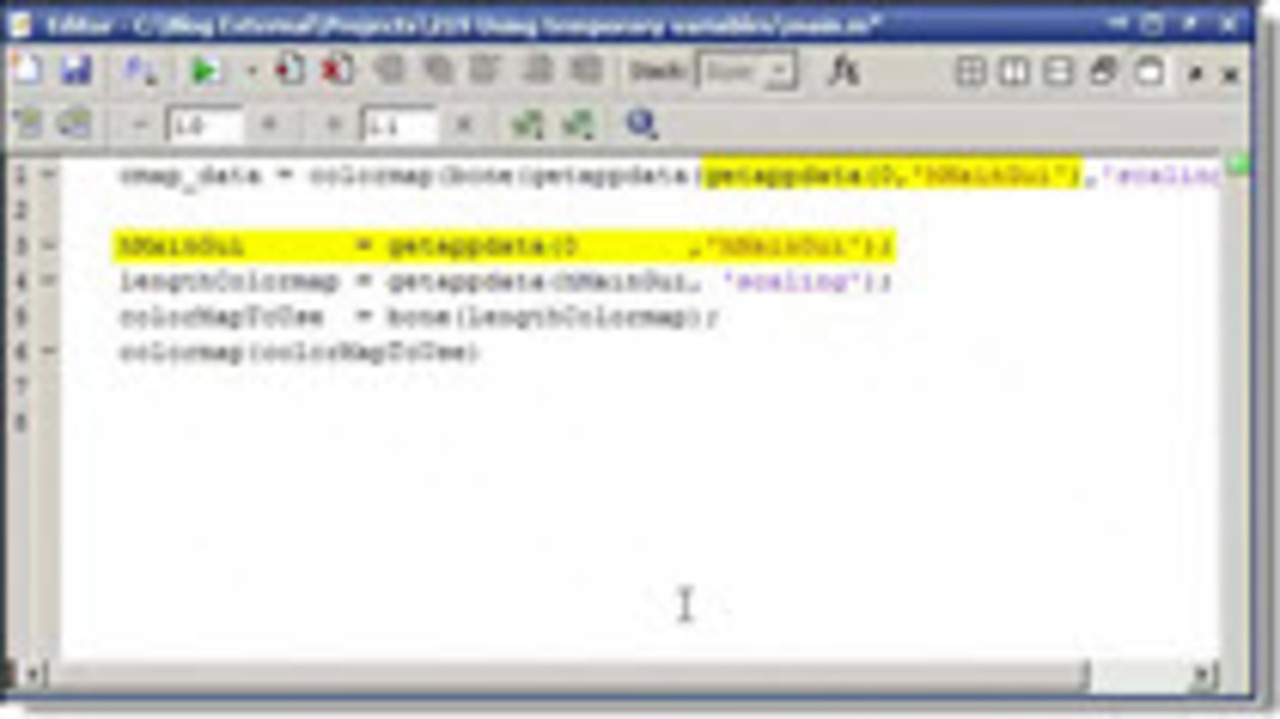
Even though you can have the output of one function act as the input to another directly, this can be confusing to read. Sometimes, using temporary variable will allow you to clarify your… read more >>
As with many math geeks, I am fascinated with games of “probability theory and applied psychology” (also known as Poker!). At a recent game this debate came out: “Does running it… read more >>
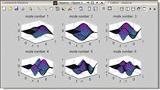
In this MATLAB video we show how you can manipulate the clim property of an axis to determine the points that an image will saturate the colormap. This is often a better choice than making a strange… read more >>
if (typeof(playerLoaded) === ‘undefined’) {var playerLoaded = false;}(function isVideojsDefined() {if (typeof(videojs) !== ‘undefined’) {videojs(“mathworks-brightcove-player”).on(‘loadedmetadata’,…
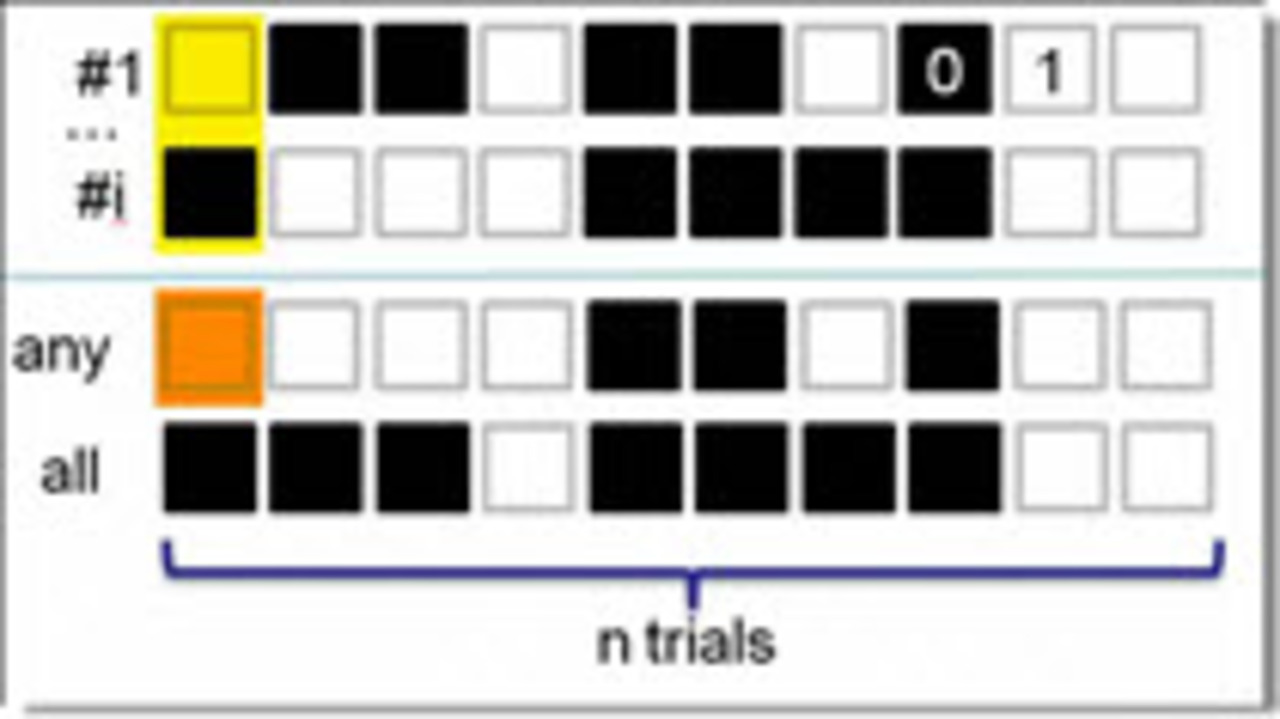
This short video shows an example of finding out if all or any of the values of a matrix are true in MATLAB. if (typeof(playerLoaded) === ‘undefined’) {var playerLoaded = false;}(function… read more >>
You and I are both here because we use MATLAB. I use MATLAB a lot, and odds are pretty good you do to. I went to some fancy-pants engineering schools, but I am pretty sure I am not an… read more >>
These postings are the author's and don't necessarily represent the opinions of MathWorks.