
Debugging C/C++ S-Functions
If you are going to work with C or C++ S-Functions, you will probably need to do some debugging.
My advice is: Don't go with the printf debugging approach. I did that for too long and now I realize it was a waste of my time. Once you discover how simple and more efficient it is to use an actual debugger when developing C Mex S-Functions, you will never go back.
This week I want to show how easy it is to attach an external debugger to MATLAB and debug s-functions. The following is an adaptation for C-Mex S-functions of the MATLAB documentation page Debug C/C++ Language MEX-Files.
Setting up the compiler
To begin, you need a development environment that provides source code debugging. In this post, I will use Microsoft Visual Studio 2010 Express on the Windows operating system and GDB, the GNU Project debugger, on Linux.
Once your compiler is installed, you need to select it using:
mex -setup
Compiling with debug symbols
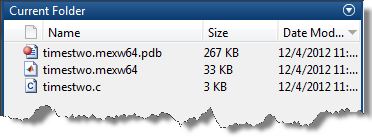
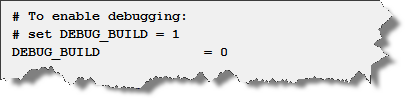
You need to compile the S-function source file with the -g option, which builds the file with debugging symbols. For example:
mex -g timestwo.c
On Windows, you will see an additional PDB file containing the debug symbols:
Attaching to the MATLAB process in Visual Studio
In Visual Studio, go to the Tools menu to attach to the MATLAB process:
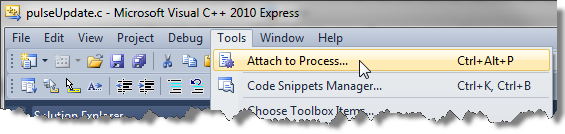
***If you do not see the Attach to Process option, enable Expert Settings by going to: "Tools -> Settings -> Expert settings".
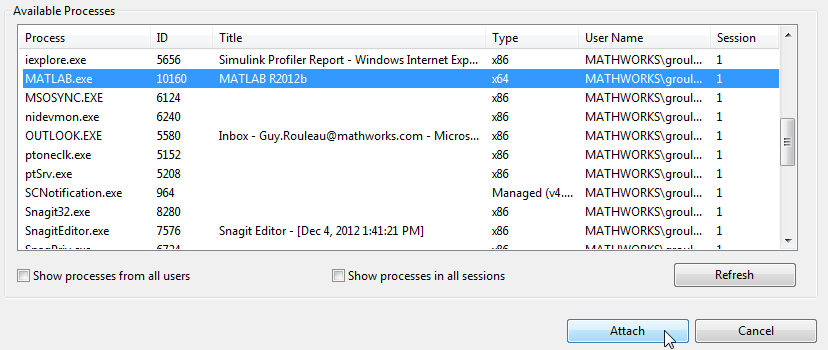
This will launch a window where you can select MATLAB.exe and click Attach.
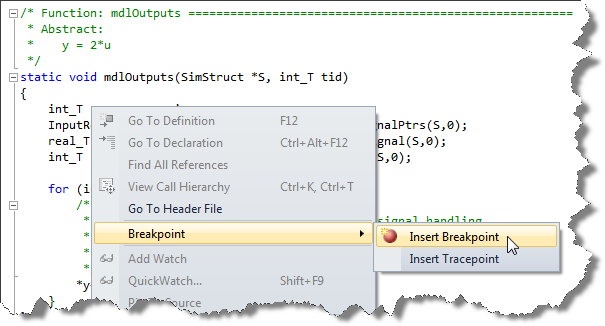
Open the source file of your S-function in Visual Studio and set some breakpoints:
Attaching to the MATLAB process using GDB
If you are a Linux user, you have many options to debug your S-Function. I will show you the one I typically use.
First, launch a terminal and identify the MATLAB process ID using a line like:
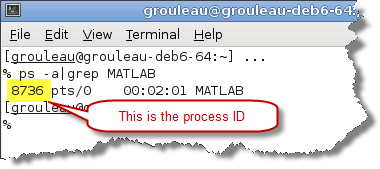
Then launch GDB by typing gdb in the terminal.
In GDB, the first thing you do is to attach to the MATLAB process. For the example above, you would type:
attach 8736
Once GDB is attached to the MATLAB process, you can set breakpoints and watchpoints, for example:
break timestwo.c:mdlOutputs
Finally, restore the execution of MATLAB by executing:
cont
Debug
Whether you are on Linux or Windows, hit play in your model. The focus should automatically go to the debugger as soon as a breakpoint is reached. From here, consult the documentation of your debugger on how to take advantage of its specific features.
Only for Debugging
It might seems strange to have to say this, but a debugging process like this should only be done when you are investigating a problem. When debugging you have access to the inner workings of a running program. It is possible to use the debugger in such a way as to corrupt that session of MATLAB and Simulink. For this reason, only use this process when you are debugging.
Now it's your turn
How do you debug your S-Functions? Please share with us your tips and tricks by leaving a comment here
- Category:
- Debugging,
- S-functions


Comments
To leave a comment, please click here to sign in to your MathWorks Account or create a new one.