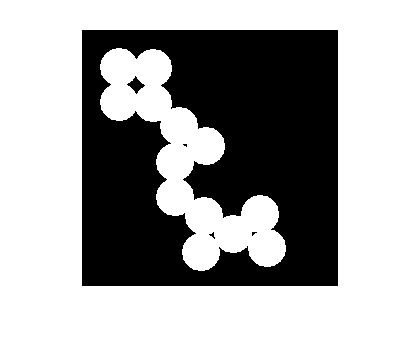
One of the first steps in analyzing images is to threshold the image. This converts an image from color to black and white, by setting every pixel below a threshold to black and above to white. This prepares the image for more sophisticated tasks, such as blob analysis for counting and classifying objects. The biggest challenge in thresholding an image is picking the right threshold value. Set it too low, and every bit of noise shows up. Set it too high, and you end up with a very black image.
The
Image Processing Toolbox provides a function (GRAYTHRESH) that analyzes the image to pick the best threshold value. This is great in many cases, but there are often times that you just want to try out different values manually. This is where Bob Bemis' really useful (and slick)
Thresholding Tool comes in. This simple, interactive, tool, shows the original and thresholded images, along with an intensity histogram of the original image. You slide a cursor along the histogram to select a new thresholding value.
There are two things I really like about this submission:
- Bob wrote it so that you can easily incorporate it into your own application or script, in addition to having it run as a stand-alone interactive tool.
- Bob used VLINE, another of my favorites from the File Exchange. It's great to find files incorporating or building on other files from the File Exchange.
Note: This submission requires the Image Processing Toolbox
 Cleve’s Corner: Cleve Moler on Mathematics and Computing
 The MATLAB Blog
 Guy on Simulink
 MATLAB Community
 Artificial Intelligence
 Developer Zone
 Stuart’s MATLAB Videos
 Behind the Headlines
 File Exchange Pick of the Week
 Hans on IoT
 Student Lounge
 MATLAB ユーザーコミュニティー
 Startups, Accelerators, & Entrepreneurs
 Autonomous Systems
 Quantitative Finance
 MATLAB Graphics and App Building


Comments
To leave a comment, please click here to sign in to your MathWorks Account or create a new one.