
Zoom Plot
Sean's pick this week is zoomPlot by Kelsey Bower.
(No - it's not the matrix of faces that you see in a conference call!) My pick this week allows you to zoom in on specific region in a line plot.
Let's plot some data:
T = readtable('C:\Documents\MATLAB\FlightTestData.xlsx');
plot(T.LoadFactor);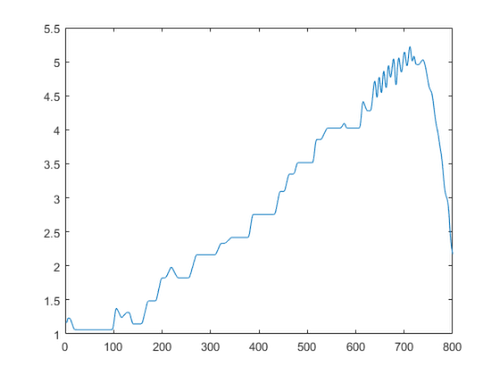
There are some interesting dynamics near the upper right hand corner. I'd like to show them with more detail. I can simply add a zoomPlot to this.
[~, z] = zoomPlot((1:800).', T.LoadFactor, [615 740], [0.2 0.5 0.4 0.4]);
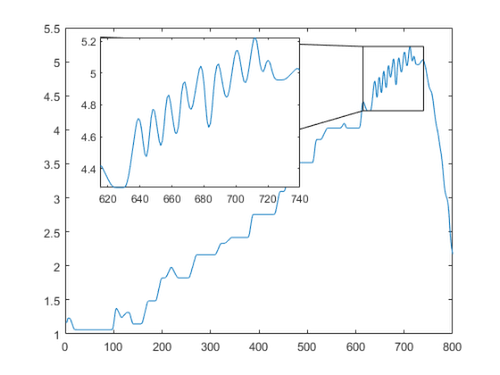
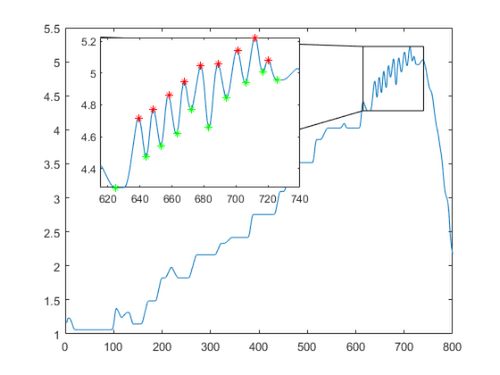
The detail is more clear. Now we can highlight the local minima and maxima in this zoomed in plot.
xzoom = 615:740;
loadfactorzoom = T.LoadFactor(xzoom);
imax = islocalmax(loadfactorzoom, 'MinProminence', 0.05);
imin = islocalmin(loadfactorzoom, 'MinProminence', 0.05);
hold(z, 'on');

plot(xzoom(imax),loadfactorzoom(imax), 'r*')
plot(xzoom(imin),loadfactorzoom(imin), 'g*')
Now if you did want a zoom plot like you'd see in a virtual meeting, use tiledlayout, which is new in R2019b and replaces subplot workflows.
figure
t = tiledlayout('flow', 'Padding', 'none', 'TileSpacing', 'none');
images = dir(fullfile(matlabroot, 'toolbox\images\imdata\*.jpg'));
for ii = 1:numel(images)
    nexttile(t)
    imshow(fullfile(images(ii).folder, images(ii).name))
end

Comments
Give it a try and let us know what you think here or leave a comment for Kelsey.
- Category:
- Picks


See Also
-

Dynamic plot zooming
Blogs
-

linkzoom
Blogs


Comments
To leave a comment, please click here to sign in to your MathWorks Account or create a new one.