Logging Simulation Data in Timetable format
In case you did not notice, MATLAB R2016b introduced a new type of table: timetables. Because Simulink logs data over time, we decided in R2017a to give the possibility to use this format for signal logging.
Configuring the Model
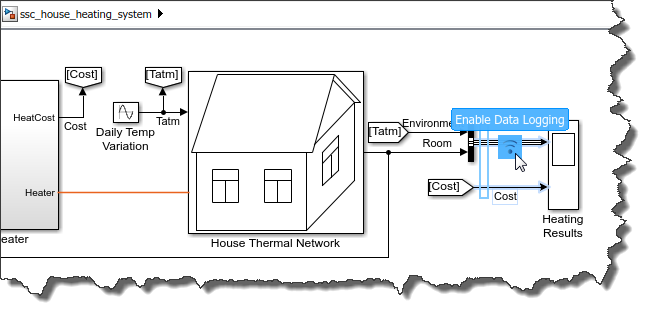
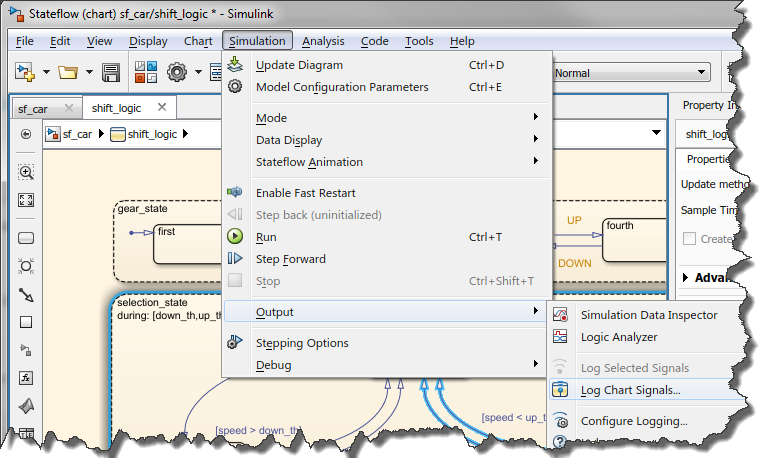
First, you need to enable logging for some signals. For this example, I chose a house heating example, where the simulation duration is a week. I log the inside and outside temperatures, along with the energy cost. Such a long application is particularly appropriate for timetables. You will see why later.
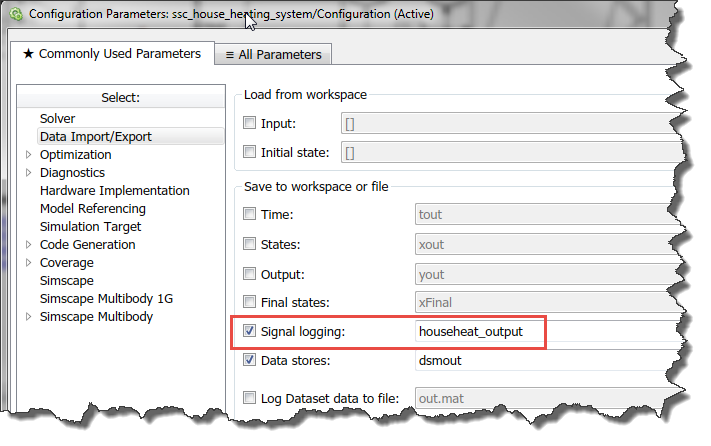
Next, in the model configuration, ensure Signal Logging is enabled.
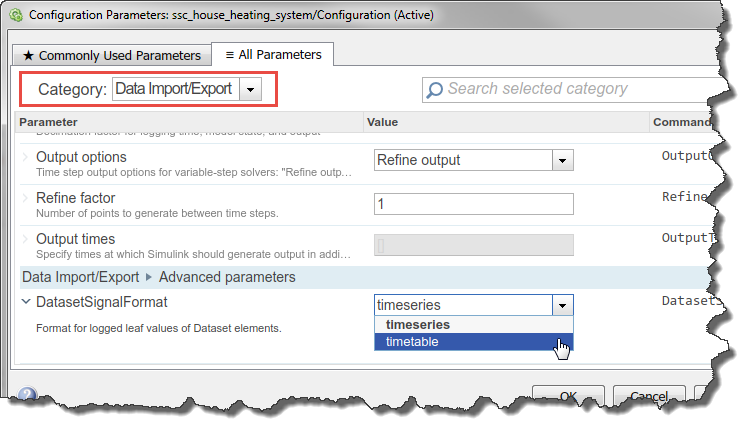
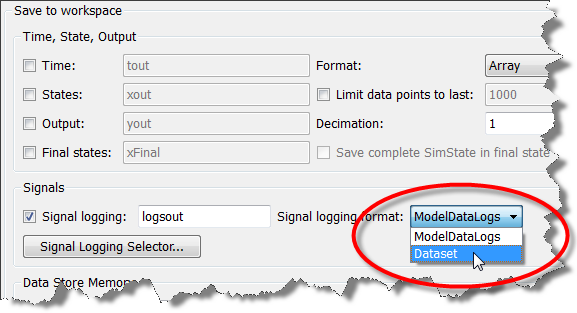
Finally, in the model Configuration Parameters, switch from the Commonly Used Parameters tab to the All Parameters tab. Select the Data Import/Export category, and scroll to the bottom. The DatasetSignalFormat parameter allows you to choose between timeseries and timetables. (Note: If you prefer, you can also type "DatasetSignalFormat" in the search box)
Exploring the Simulation Output
After simulating the model, a dataset object is created in the MATLAB workspace.
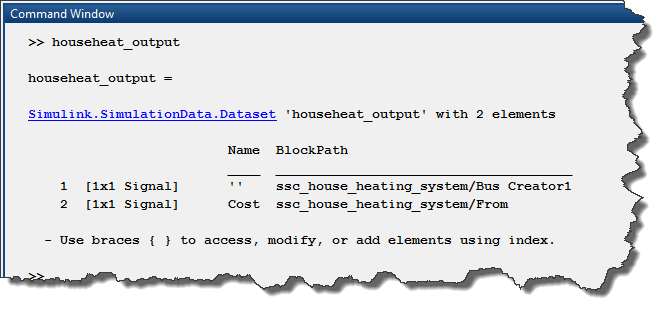
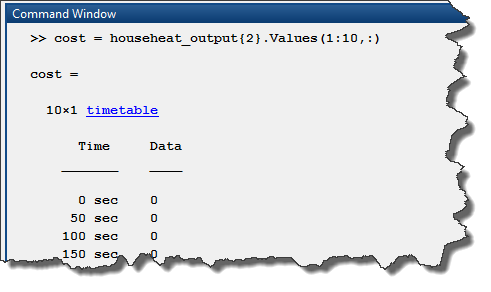
For example, we can access the first ten points of the timetable for the "cost" signal using:
Advantages of Timetables
As mentioned previously, the example used here simulates for a long period of time (7 days). Let's look at a few features of the timetables that are particularly useful for such simulation.
The first obvious advantage is that you can select the units in which the time is displayed.
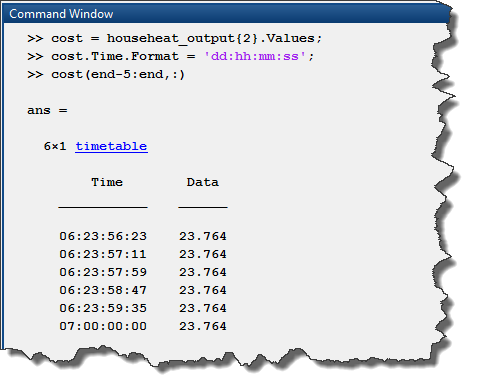
You have to admit that 6 days and 23 hours is easier to understand than 682560 seconds.
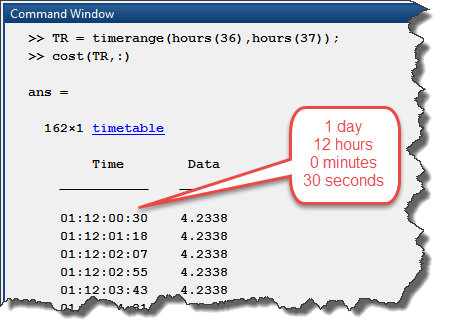
One thing I like is the indexing based on time. For example, if I want the data between the 36th and 37th hours of the simulation, I can simply define a timerange to index in the timetable:
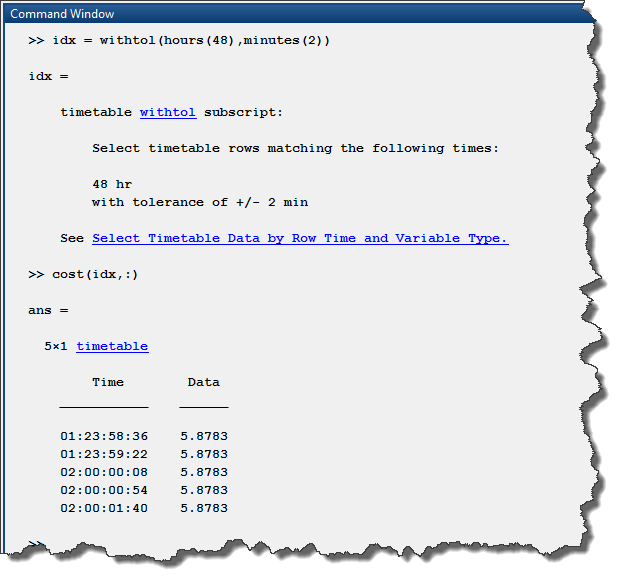
In a similar way, if I want to extract a few points around a specific instant, I can create a withtol subscript. In the following example, I extract the points within a +/- 2 minutes range around the 48th hour of simulation.
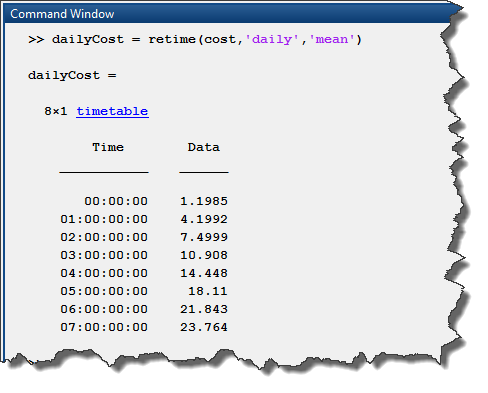
Using retime, it is possible to aggregate data quite easily. The following line returns the average value for each day of simulation.
Those are just a few basic examples. I recommend looking at the timetable documentation for more advanced maneuvers.
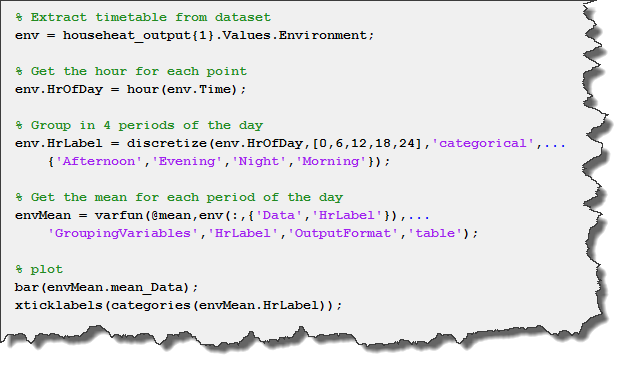
In my case, based on the example Preprocess and Explore Time-stamped Data Using timetable, I have been able to group the data in four periods of the day (AM, PM, evening and night) and get an average of the outside temperature for each of those periods during the entire week the simulation lasted.
Now it's your turn
Have you already adopted or considering adopting timetables to log your simulation data? Let us know what you think of this new feature by leaving a comment below.
- Category:
- Analysis,
- Commands,
- What's new?




Comments
To leave a comment, please click here to sign in to your MathWorks Account or create a new one.