Logging Stateflow Data and States Activity
Today I want to describe a feature that is super useful, but not known enough: Logging states activity and data in Stateflow.
Logging Stateflow Data
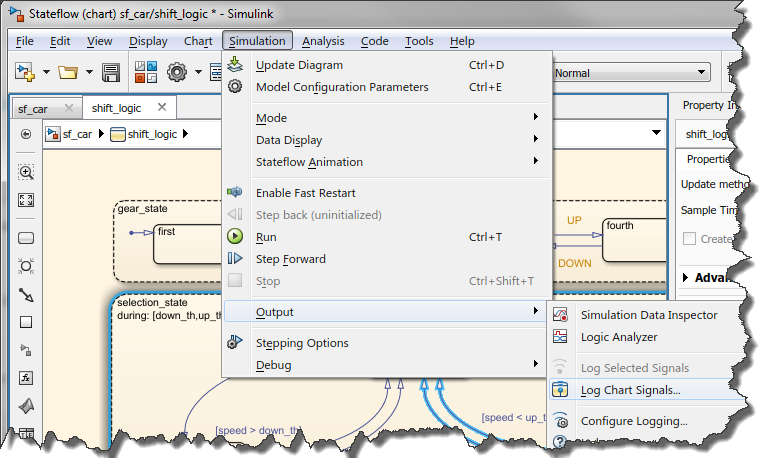
If you want to quickly enable or disable logging for variables and states, select Log Chart Signals... from the Simulation menu.
This will give you a flat list of all the items you can possibly log in your chart.
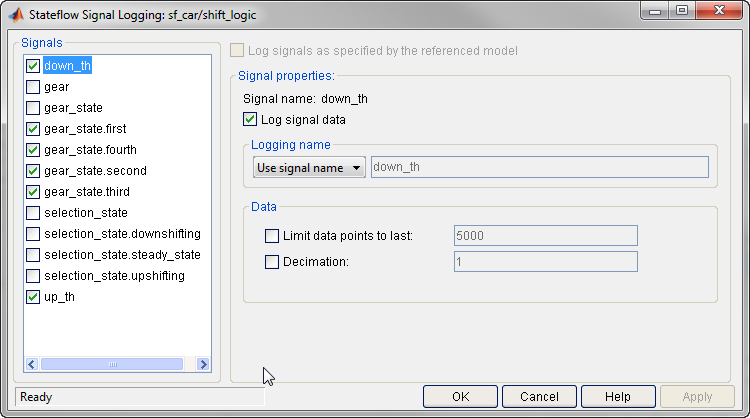
See this documentation page for more ways of configuring Stateflow logging.
Logging Stateflow Data From Command Line
I know many of you will ask if it is possible to control Stateflow logging programmatically. For that, you can use the Stateflow API.
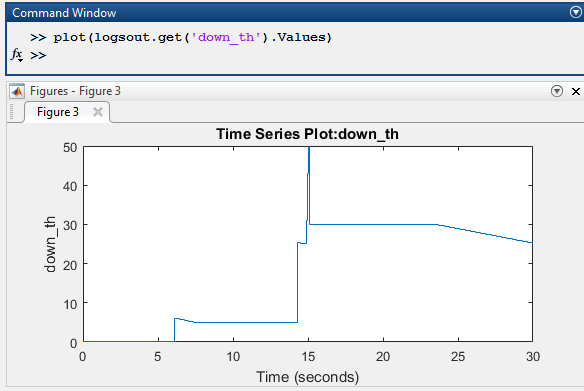
Let's say I want to log the local variable down_th for the example model sf_car.
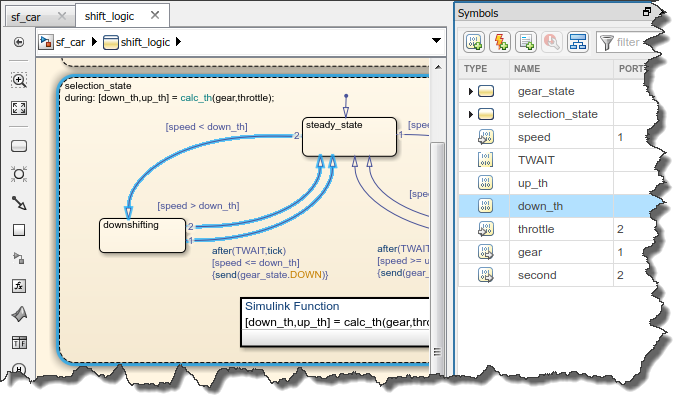
All you have to do is get a handle to the Stateflow root object, use the find method to search for data or states, and set the logging property to true.

Visualizing logged data
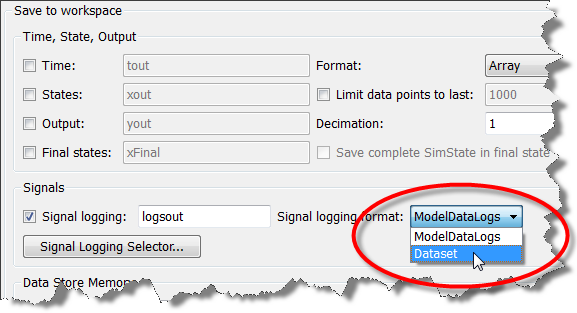
Once logging is enabled for data and states, enable Signal Logging in the model configuration. At the end of the simulation, a dataset object appears in the MATLAB workspace.
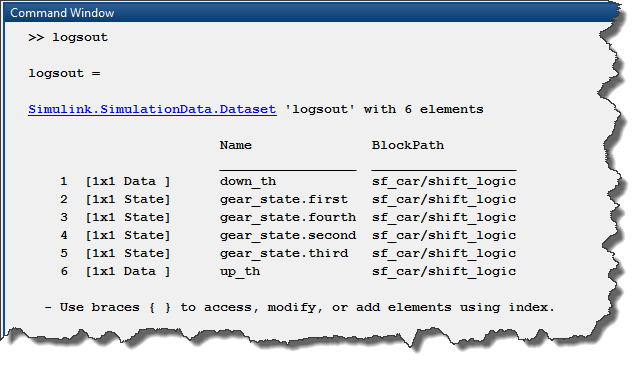
You can easily plot the data using the plot method of the MATLAB timeseries objects inside the dataset:
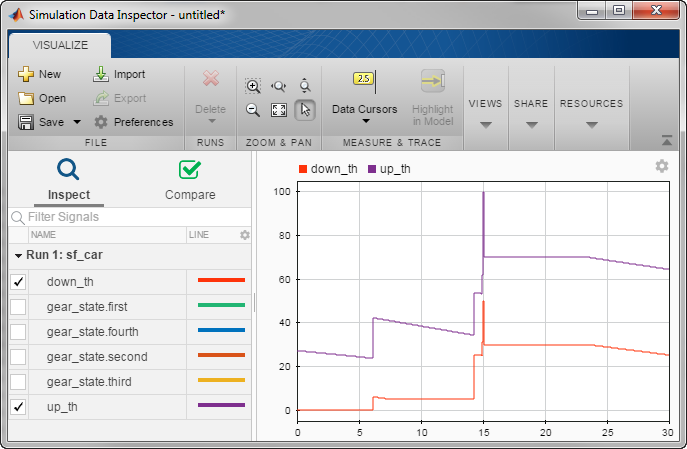
If you prefer, you can also directly stream the Stateflow data to the Simulation Data Inspector. For that, enable the Record logged workspace data in Simulation Data Inspector from the model configuration. At the end of the simulation, the logged data will show up in the Simulation Data Inspector automatically.
Now it's your turn
Are you taking advantage of the Stateflow logging? Let us know what you think of this feature in the comments below.
- Category:
- Simulink Tips,
- Stateflow




Comments
To leave a comment, please click here to sign in to your MathWorks Account or create a new one.