As you probably know, it is possible to integrate C/C++ code in Simulink simulations. This can be done in many ways, including:
- C/C++ S-Function
- S-Function Builder
- Legacy Code Tool
- C Caller
- C Function
- MATLAB Function
- MATLAB System
- Stateflow chart
A long time ago, I published a blog post describing how to debug C/C++ S-Functions. At that time, the process was complex and required you to manually mex the S-Function with debug flags and attach the debugger to the MATLAB process. In recent releases, we have greatly simplified the process. In this post, I will highlight how this can be done in two ways:
Initial Setup
This page lists the supported blocks along with the compilers and IDEs supported for different operating systems.
On Windows, to use the Microsoft Visual Studio debugger, you will likely need to set a Windows registry key. You can see if this registry key entry is already configured by executing this line of code:
Set Breakpoints in Custom Code
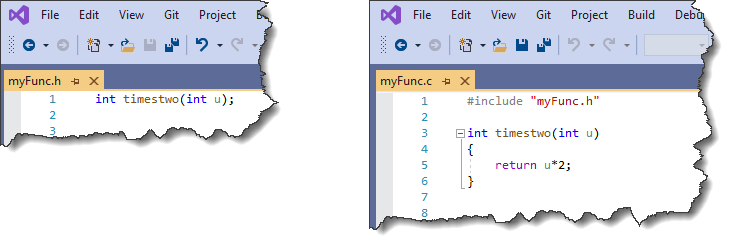
To illustrate this process, I used the following simple C file and header:
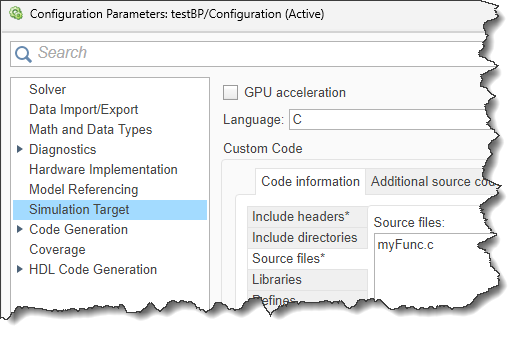
I created a new model and specified the C file in its configuration:
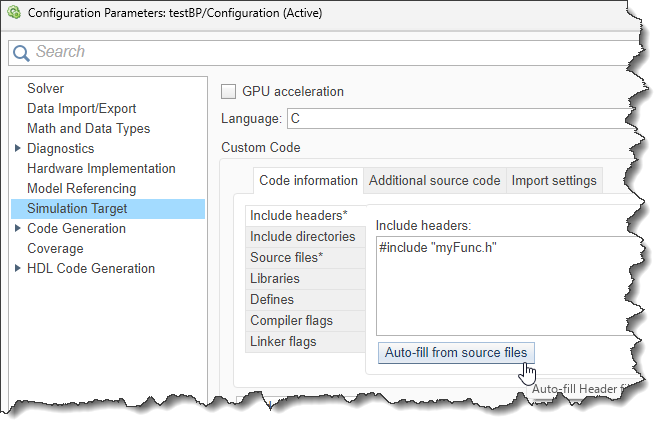
I then switched to the Include headers section and used the Auto-fill from source files button to automatically fill the include headers text:
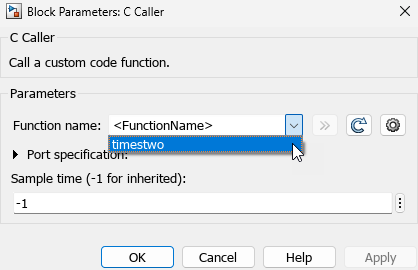
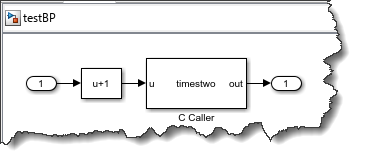
I added a C Caller block to the model and could now select my function in its dialog: I connected inputs and outputs to the C Caller block to have a working simulation:
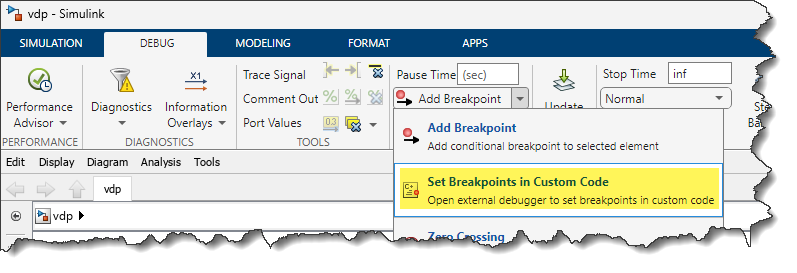
In MATLAB, I use mex -setup to ensure that I have Visual Studio selected as compiler. In the Debug tab of the Simulink model, I can then click on Set Breakpoints in Custom Code:
The model status bar will tell us that it is launching the external debugger
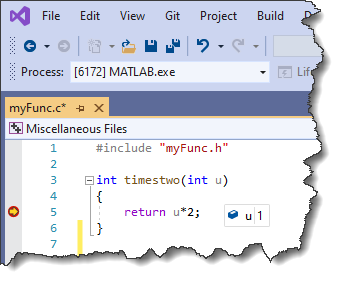
Microsoft Visual Studio will open the C file and automatically attach to the MATLAB process. At this point, you can set breakpoints in the custom code, click play in Simulink, and inspect the C code when the breakpoints is hit:
MinGW and Visual Studio Code
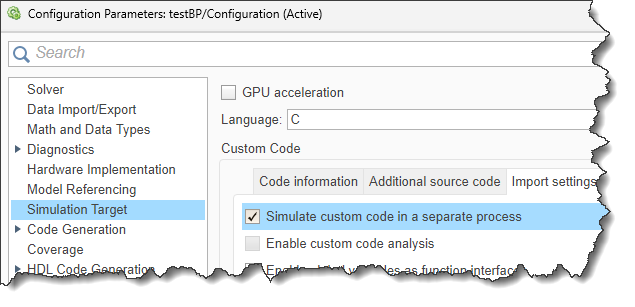
Debugging custom code in Visual Studio Code is only supported when the custom code is simulated in a separate process. In general, it's a good idea to simulate custom code in a separate process when debugging. That way, if the custom code crashes, it will not crash the MATLAB session with it. This option can be enabled here: Once this is done, the process is similar to the one described above with Visual Studio. Click the Set Breakpoints in Custom Code button in the Debug tab of the toolstrip, this will launch Visual Studio Code and attach it to the MATLAB process. Add the breakpoints in the code and simulate the model.
Now it's your Turn
Are you leveraging this feature to set breakpoints and debug your custom C code? Do you prefer to use Visual Studio or Visual Studio Code to debug your C code?



 Cleve’s Corner: Cleve Moler on Mathematics and Computing
 The MATLAB Blog
 Guy on Simulink
 MATLAB Community
 Artificial Intelligence
 Developer Zone
 Stuart’s MATLAB Videos
 Behind the Headlines
 File Exchange Pick of the Week
 Hans on IoT
 Student Lounge
 MATLAB ユーザーコミュニティー
 Startups, Accelerators, & Entrepreneurs
 Autonomous Systems
 Quantitative Finance
 MATLAB Graphics and App Building




댓글
댓글을 남기려면 링크 를 클릭하여 MathWorks 계정에 로그인하거나 계정을 새로 만드십시오.