This short video covers the thought process of rewriting some code for clarity. The six lines of code are lengthened into twice that. The code is much more readable and maintainable. The problem… read more >>

This short video covers the thought process of rewriting some code for clarity. The six lines of code are lengthened into twice that. The code is much more readable and maintainable. The problem… read more >>
The “Rules of the new game” puzzler was the most difficult one yet. Puzzlers are MATLAB programming challenges that I post from time to time. They lead to interesting discussions of… read more >>

I was once one of the many people that have been a steward of the Pick Of The Week blog. I try not to highlight File Exchange files here, but this exceptional tutorial is, well, an… read more >>
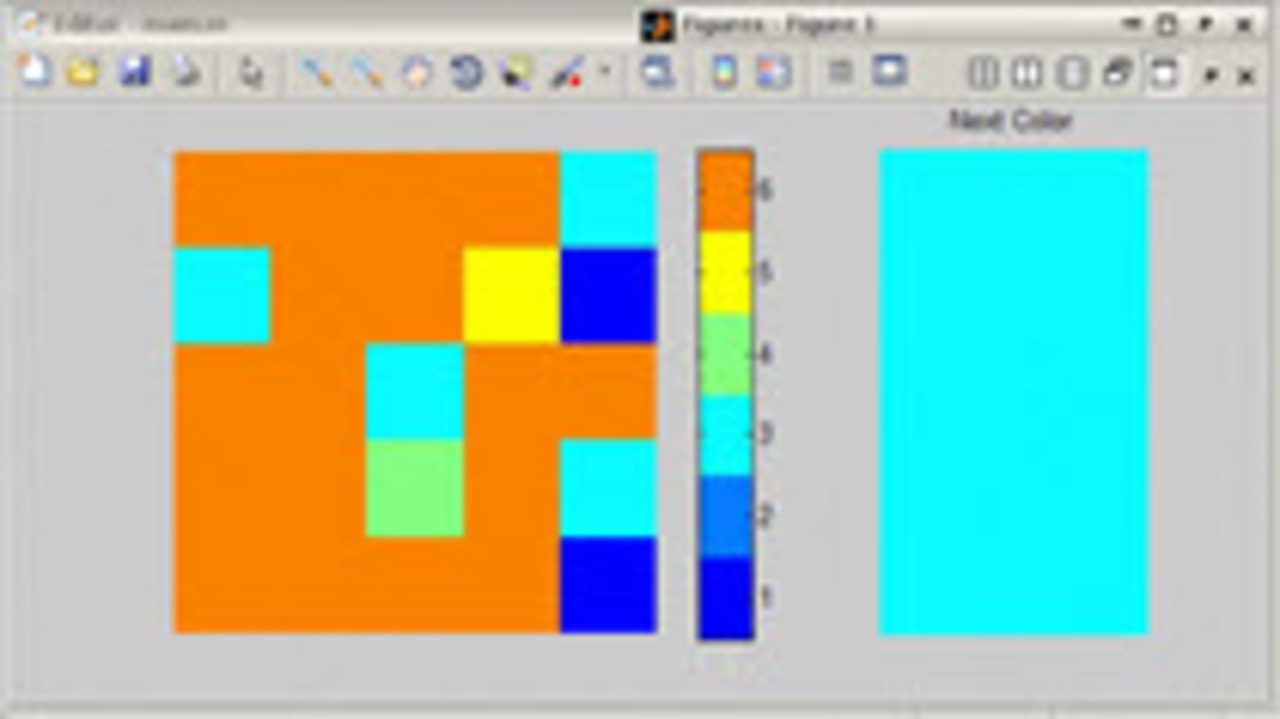
I was playing a game by LabPixies on my iPhone. I spent more time thinking about programming an optimal solution than anything else while playing. I decided to give it a try in MATLAB. After… read more >>
I frequent Twitter as MATLABDoug. You can check there for daily MATLAB tips in 140 characters or less, blog post announcements and other things that I find interesting. While reading the… read more >>
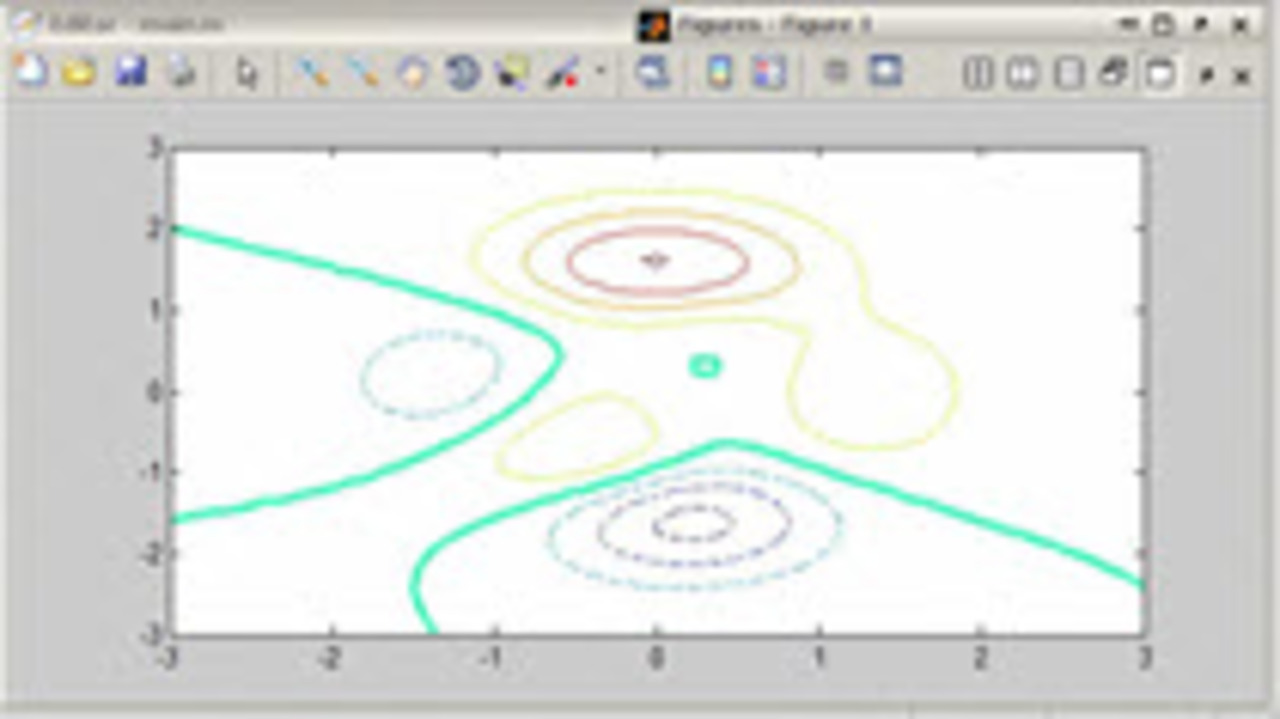
The contour plot will choose the colors of the contour lines based on the level of the contour. However, if you want to do something more, like change the line width or line style, you will need to… read more >>
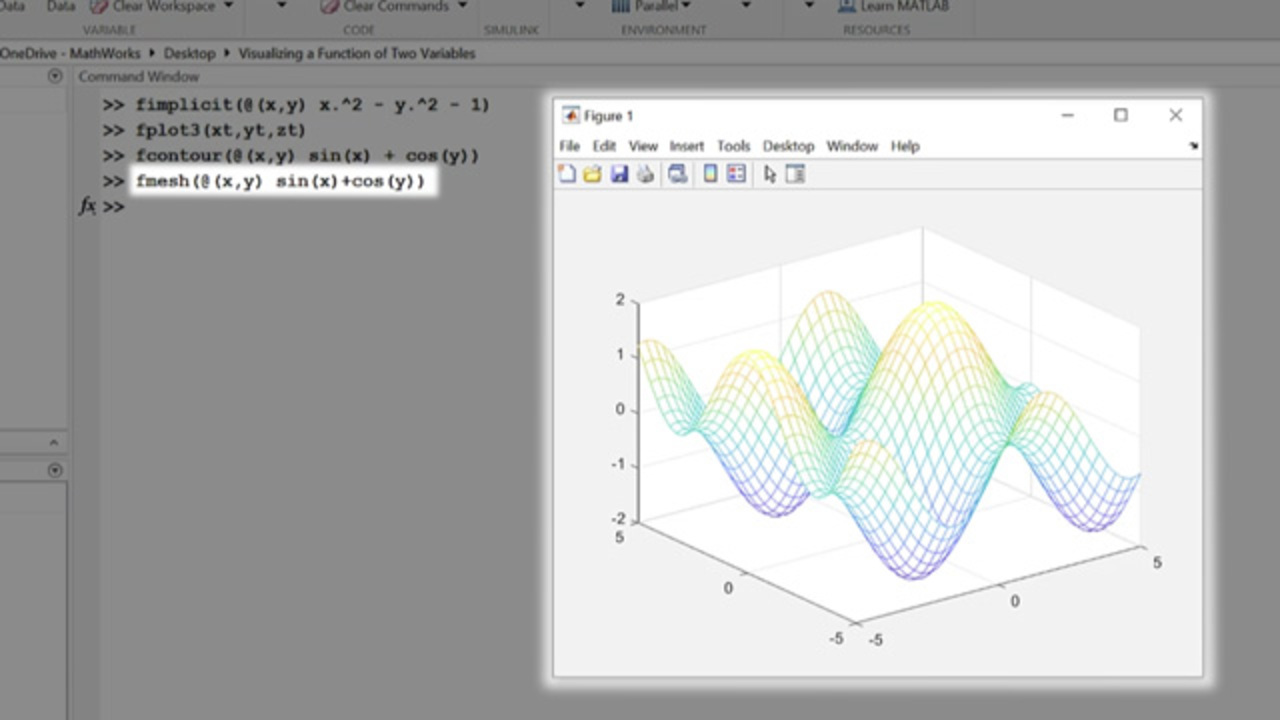
I was interested in visualizing isolines on a graph of BMI. This is a non-linear function of two variables. I thought the best way to visualize this would be with a contour plot. This video… read more >>
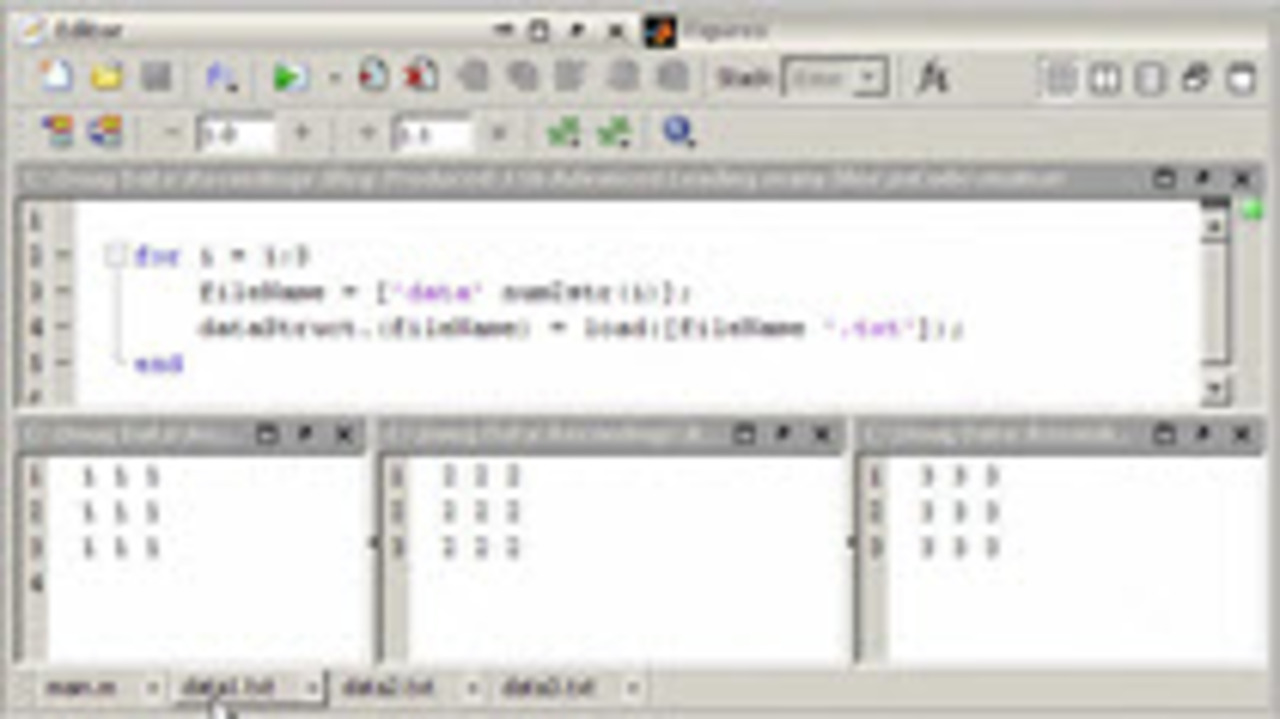
In this short video we will show how to bring text files into MATLAB and use the original file name as the variable name. Actually, the file name will be used as a field name in a… read more >>
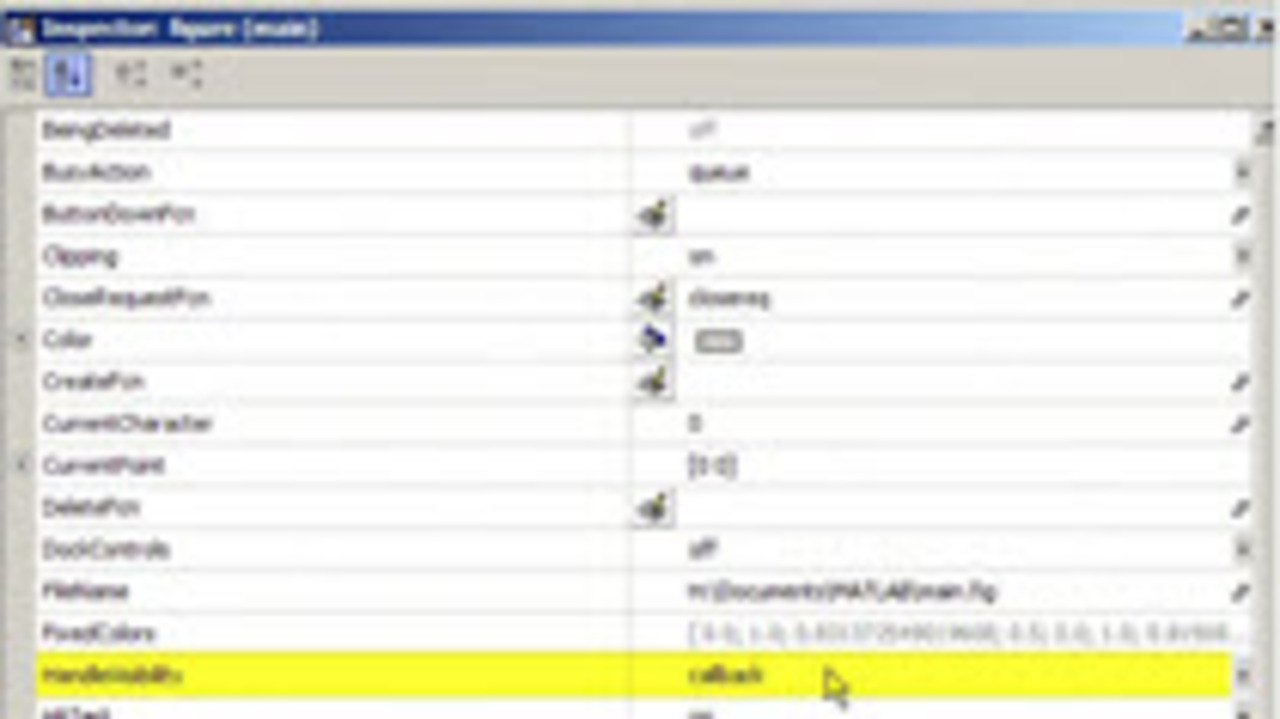
A MATLAB user recently asked me why they could not find the handle to their GUI as a child of the root. get(0, ‘children’) The reason is they needed to change the… read more >>
This week, I was going to make a great video on recursion to solve a fun little puzzle. However, my code runs too slow. Before my recursive solution to the larger puzzle is practical, I need to… read more >>
These postings are the author's and don't necessarily represent the opinions of MathWorks.