Seth on Simulink
July 27th, 2008
How To Make Your Own Simulink Block
Today I want to introduce a fundamental Simulink concept: masking
a block. Masking provides you with a way to put an interface on an
algorithm. This can centralize the system parameters for easier viewing, or hide
the complexity from unintentional tampering by other users. Masking can also
be used to dress up your model for more inviting or professional looking
presentations. Let me show you how by masking a subsystem that I made.
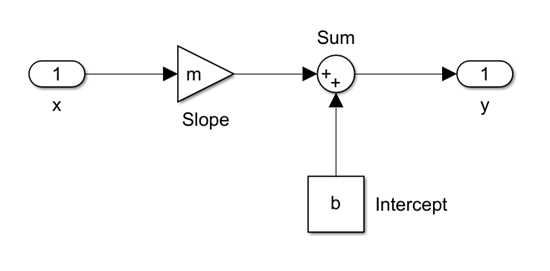
The subsystem holds the algorithm
In my example, I am masking a subsystem that contains a
fixed limit saturation algorithm:

I will come back to this in my examples below.
Improved Presentation: The Mask Icon
Simulink models provide an executable specification. The
model allows you to share a picture of the system schematics that can be
understood by everyone on the team, especially your boss or customer. The best
way to do this is to make the components in your diagram really obvious. A
great example of this is the f14_digital demo model. This model uses images for
the icon on three root level subsystems.

You can grab a picture of the stuff you are modeling and put
it on the corresponding subsystems. To do this, use the Edit > Mask
Subsystem... menu when the block is selected. This is also available from the right
click menu on the block. This opens the mask editor and brings up the icon tab
for the block.

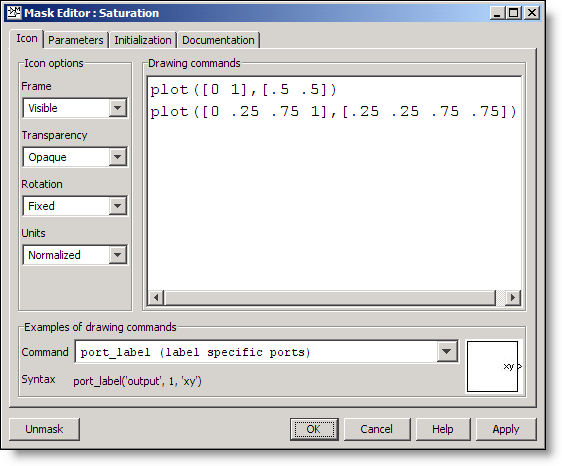
For my Saturation subsystem I have used the basic plot
command to put an icon on the block. I set the Units to normalized, which
provide x and y range from zero to one for the canvas.

The allowed drawing commands are a subset of MATLAB graphics.
There are examples at the bottom of the mask editor. The image command can be
combined with IMREAD to load an image from your MATLAB path. For example, the
following drawing command adds a Boeing 747 icon to your block
image(imread('b747.jpg'))

Adding an icon to your system doesn’t change the behavior.
When you double click on the block, you will still open the system it contains.
Mask Dialog and Documentation
A mask can also provide a simplified interface to the blocks
underneath. As a trainer, I used to introduce this concept as a method for
preventing unintended tampering with the contents of your system. The parameters
tab of the Mask Editor is where you set the parameters for the system.

The Prompt is the string you want to display before the box
where the user enters the value. The Variable holds the value entered in the
mask. Adding dialog parameters creates a local workspace for the blocks under
the mask. In my fixed saturation example, the up and lo constant blocks will
now use the variables from the mask as their value, instead of hard coding the
constant in those blocks.

Add some details to the documentation
tab to complete the mask dialog.

Mask type is used to specify a title for the dialog. Mask
description shows up right below that and provides a place for some quick
reference documentation. The Mask help field can be a long description that
will be displayed as HTML when the user pushes the Help button. HTTP links are
also acceptable. For a full list of the Mask help alternatives click
here. Double clicking on the icon of the Saturation block displays the finished
dialog:

As you make edits in the Mask Editor you will notice that
your parameter values in this dialog are set to 0. Before you finish with your
mask, make sure to set the parameter values for your system in the dialog.
How do I get back to the system?
Now that the block has a mask, double clicking on the icon
opens the mask dialog. The way you know you are looking at a mask dialog is
the label following the system name: Saturation (mask). To see the
algorithm beneath the mask, right click on the block and select Look Under
Mask. This will bring you back to the contents of the system.
Now it’s your turn
This is the tip of the masking iceberg. Do you have masked
blocks in your model? What tricks have you used to polish up your model and
make it look professional? Tell me about it here.
23:58 UTC |
Posted in Libraries, Masking, Modeling |
Permalink |
You can follow any responses to this entry through the RSS 2.0 feed.
You can skip to the end and leave a response. Pinging is currently not allowed.
Leave a Reply
|
I use the mask to display the values set in the mask parameters so the user can easily see what values have been set for the model. If unit-ed values (from units class) are used, the displays will show the appropriate units as well and convert the values back to doubles for use in the simulation. Text colors are changed to indicate different states of the parameter options or if an uninitialized condition exists in the model.
I also use functions to auto pad images so they display correctly on top of a subsystem as it is resized.
It is unfortunate (at least in 2007B) that the print to HTML web view do not capture the mask displays or give you an option to capture the mask displays.
Dear Seth,
I agree that masks are a very useful concept and I use masked blocks a lot. Together with the atomic subsystem property and hierachical resolution set to “none” you get the equivalent of a function for a Simulink block (clearly defined interface and execution order).
Just two questions / enhancement requests:
- Is there a shortcut for right click - look under mask? If you have a lot of masked subsystems it is really unconvenient allways to use the context menu.
- Please allow direct masking of Embedded Matlab function blocks, which is currently not possible. The behaviour could be as usual for masked subsystems:
left click - show mask dialog
look under mask - open Embedded Matlab editor
Today I have to wrap even a single Em function block with a subsystem to be able to use masks.
Best Regards
Georg Wiedermann
Hi,
Is it possible to display a picture on the subsystem (for. e.g image(imread(’b747.jpg’)) ) and sitll have the port names visible. Currently the port names get hidden when the picture is displayed. I dont want to specifically name the ports as port_label(’output’, 1, ‘xy’) etc. It should be dynamic.
Cheers,
Ryan
@Ryan - The current mask icon behavior doesn’t allow for using images and transparent masks. I have added your name to the list of people who have requested this.
As a workaround, if the number of ports on your block is not changing, you can use some Mask Initialization code to get the names and port numbers:
inputs=find_system(gcb,'LookUnderMasks','on','BlockType','Inport')
for i = 1:length(inputs)
s.([’port’ num2str(i)]) = str2num(get_param(inputs{i},’Port’))
s.([’name’ num2str(i)]) = get_param(inputs{i},’Name’)
end
Then, in the mask icon drawing commands you can use the port labels.
image(imread('b747.jpg'))
port_label(’input’,s.port1,s.name1)
port_label(’input’,s.port2,s.name2)
port_label(’input’,s.port3,s.name3)
If there is a change to the name on a port, you will have to trigger the mask initialization code to refresh the names on the icon.
Thank you very much Seth.Hope to see something in the future releases of Simulink on this.
Cheers,
Ryan
Hi
Is there a way to add an image to a mask and somehow link it permanently. I can successfully add an image to my mask, but as soon as I move out of the work directory, it cannot find the image if I want to use that subsystem.
I suggest using a command like this:
image(imread(’C:\path\to\image\b747.jpg’))
The full path should be used in the IMREAD command to avoid the problem you are describing. If the image is on the MATLAB path, IMREAD will just find it. You can test this by running:
>> which b747.jpg
This file is on the path. Try that for your image, and then try adding the path to that folder.
Thanks Seth. Worked Like a charm :)
Is there no way, you can permanently link it though? Somehow embed the image into the mask.
Another option would be to add the image data to the block UserData. I always put the user data in a structure, in case I want to include multiple variables. At the command prompt:
s.im = imread(’imagefile.jpg’);
set_param(blk,’UserData’,s)
Then, in the MaskInitialization
s = get_param(gcb,’UserData’)
And, in the mask code you should be able to call:
image(s.im)
Hi,
Is there a way to include a jpeg or even pdf image into the Mask Help box?
I tried it according to the Matlab help but it didn’t work out for me.
My goal is to write the entire help text including several pictures in another program and just save it as jpeg or pdf file.
I highly appreciate any help!
Thank you already in advance.
Seth,
Is there a way to access the value of an inport in a mask to either display it or be able to use it in logic in a callback?
Thanks,
Jay
Jay, How about use level 2 m s-function?
@Jay and Wei,
You can look at an example I made where I use a level 2 s-function to dynamically set the color of a block based on the value of a signal:
http://www.mathworks.com/matlabcentral/fileexchange/23127
It uses a level 2 M-file S-function. Using get_param and set_param, you can configure a lot of things in a running model, including mask value.
To begin, I suggest using get_param and the “objectparameters” property to see all available properties of block or model. Once you found what you are looking for, tune it using get_param.
It would also be possible to do that using an event listener… let me know if you would like to know more about event listener, I think it is another cool feature.
Guy
Guy,
Thanks for the tip. Using your example I got this to work on my PC. My problem now is trying to get the s-function to compile to an xPC.
Thanks,
Jay
Hi seth,
I am a new user of Simulink. I want to use Switch for selecting two different parameters for different interval .for example i have 12 interval in which in “Odd interval” i want one parameter and in “Even interval” other parameter.But in switch block How to put this condition in “Threshold” which does not recognize U1 or U2 etc.Please suggest me.
Hello;
I am looking at the “sum” block in the simulink math library and have two questions regarding the mask.
1) How do I control the port placement on the mask icon? Using the circle sum feature I notice that the second port enters through the bottom. How is this done?
2) What is the appropreat “plot ()” instruction to draw a circle or an elipse?
Any help will be most welcome.
Regards
David
@Dave Lewis - The Sum block is a built-in block, and the parameters dialog is not created using the Mask Editor. You can not currently control port placement, but this is a popular requested masking feature.
As far as plotting a circle, I would use SIN and COS to create the data points and then use the plot command to display them on the block icon. There is a tech support solution that shows how this is done with a MATLAB figure here. You could put the following code in the initialization commands:
And the following in your icon drawing commands:
Make sure your Icon units is set to Autoscaled.