Guy and Seth on Simulink

June 22nd, 2010

How to customize the Simulink Scope!

Blogger, Guy Rouleau By Guy Rouleau

As we all know, there is a tool for each job. You can hit a nail with a screwdriver, but the job is easier with a hammer. It’s the same thing to display Simulink data. One common question I receive in technical support is how to customize the Simulink Scope. My answer to this question is simple: Do not customize the Simulink Scope… use simplot.

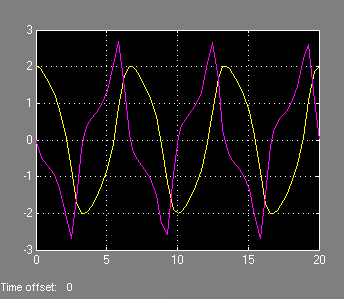
With simplot, you can easily take the data from a Simulink Scope that looks like this:

Simulink Scope

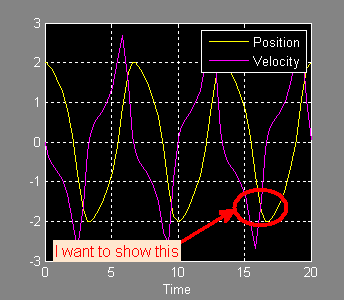
And create a MATLAB figure with annotations, legend and labels.

Figure generated by simplot

The Simulink Scope is an optimized display designed to run fast during simulation. Its job is to show signals while the simulation is running. For post-simulation analysis, creating reports and presentations, a MATLAB figure is more appropriate. The simplot function helps by plotting simulation data in a MATLAB figure that looks like the Simulink Scope.

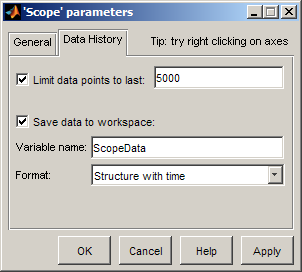
To plot the output of a Simulink model in a MATLAB figure, the first step is to save the data to the MATLAB workspace using one of these 3 options:

  • The “Save Data to Workspace” option of Simulink Scopes
  • To Workspace blocks
  • Root-level Outport blocks

To create the figure above, I saved the output of a Scope block to the variable ScopeData:

Simulink Scope parameters

After simulating the model, I used simplot to create the figure:

simplot(ScopeData)
legend('Position','Velocity')
annotation('ellipse',[0.68  0.25  0.15  0.12],...
    'EdgeColor','red',...
    'LineWidth',3);
annotation('textarrow',[.5 .68],[.2 .3],...
    'TextEdgeColor','none',...
    'TextLineWidth',3,...
    'TextBackgroundColor',[1 .9 .8],...
    'FontSize',12,...
    'Color','red',...
    'LineWidth',3,...
    'String','I want to show this');

Now it's your turn

How do you visualize the data coming out of your simulations?

11 Responses to “How to customize the Simulink Scope!”

  1. Bob replied on :

    This was very useful. I’ve wondered how to be able to work with simulink time scope output, edit, make it useful for presentations. Thanks for doing this!

  2. OysterEngineer replied on :

    I agree with Bob. This is a very practical blog entry. Keep them coming.

  3. bahar replied on :

    I have a project about simulink codes.
    I want to know how simulink analyse electrical circuits?
    I mean I want to find the c code of any block.
    thank you.

  4. kryon replied on :

    hi Im confused about the ph input in complex phase shift block.What sort of phase input should I give.I tried to give a constant but it showed something else.Im actually trying to have a phase shift of 4 in a Voltage signal.

  5. wei replied on :

    @Guy, Now it’s official that simplot will be gone in a future release. Do you know if Simulink.sdi will have all simplot’s capability? What;s future for Signal and Scope Manager?

  6. Thomas replied on :

    This seems less like a solution and more like a work around.

    I had this problem recently: I wanted to show a simulation in front of a big audience. But the purple line on a black background is just not visible on the projector, so this was a very poor experience.

    Messing around with plot is not an option in a lecture, so is there a proper solution to the problem? Ideally it would show the scope on a white background, and use stronger lines than the “default” (or only) option.

  7. Fabian replied on :

    Guy, great tip. Now, add that to StopFcn callback of the scope block and the new figure appears automatically after the simulation.

  8. Carlos replied on :

    Completely agree with Thomas (6): that is just a work-around, and not very convenient to be honest. Other software tools like SimulationX have already much better display options as Simulink. I think it’s time you update your scopes.

    - Scopes should be dockable means “Drag&drop”.
    - One should be able to change the color of the signals easily with a palette.
    - Legends should be a “toggle” button in the scope and should show by default the name of the signals, even when they come from a bus or a mux.

    Like already said, take a look at Dymola oder SimulationX and copy the good ideas.

  9. Nuno Pimenta replied on :

    Hi Guy Rouleau, congrats for the post…
    If i save this image in JPG or EPS, the image appear without title and time… I can change this?

  10. André replied on :

    Great hint for that found in another thread:
    http://www.mathworks.de/matlabcentral/newsreader/view_thread/154214

    1. Open the Scope window you want to copy
    2. In the MATLAB command window, execute the following code:

    set(0,’ShowHiddenHandles’,'on’)
    set(gcf,’menubar’,'figure’)

    Now it’s easily configurable, can be exported to most graphic file formats, …

  11. Seth replied on :

    @Fabian, @Carlos, @André: In case you missed it, we posted an update on How to Customize the Simulink Scope – Take 2. Starting in R2011b the Simulink scope has a graphical property editor!

Leave a Reply

Wrap code fragments inside <pre> tags, like this:

<pre class="code">
a = magic(3);
sum(a)
</pre>

If you have a "<" character in your code, either follow it with a space or replace it with "&lt;" (including the semicolon).


MathWorks
Guy Rouleau and Seth Popinchalk are Application Engineers for MathWorks. They write here about Simulink and other MathWorks tools used in Model-Based Design.

These postings are the author's and don't necessarily represent the opinions of The MathWorks.