
Breaking up a Stateflow Chart for Collaborative Development
This week I have been experimenting with a feature released in R2010b that I have not used before: Stateflow Atomic Subcharts
The Problem
I am currently working on a model architecture where different functionalities will be developed by different people simultaneously.
Typically, when I need to componentize a Simulink model, I use Model Referencing and Block Libraries. However, for my application, the algorithms to be developed are very procedural and better suited for Stateflow.
While going through the Stateflow documentation, I ran into a page titled When to Use Atomic Subcharts and saw the following scenario:
You want to break a chart into standalone parts because multiple people are working on different parts of the chart.
That sounds exactly like what I am looking for... so let's give that a try!
Initial Design
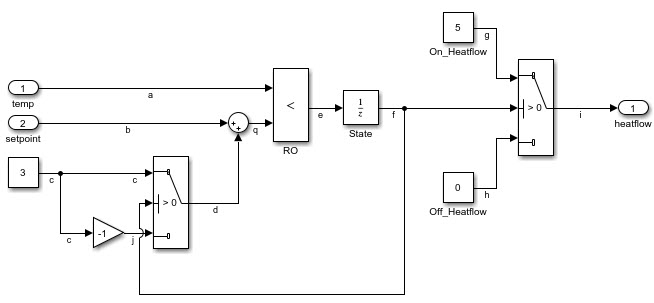
Let's start with a simple example chart:
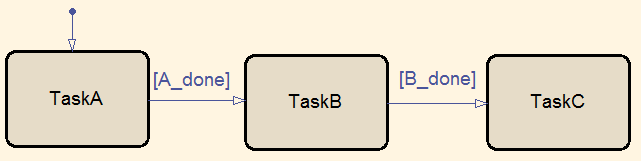
In this chart, I have 3 sub-states for 3 different tasks. At a high level, I know that TaskA will be followed by TaskB, who is followed by TaskC. Each of these tasks are pretty complex and will developed by different engineers.
So let's see how we can store states TaskA, TaskB and TaskC in different files.
Atomic Subcharts
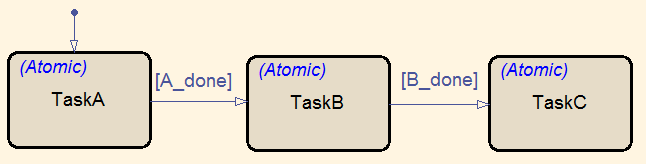
If I right-click on the states, I can select Make Content -> Atomic Subcharted.
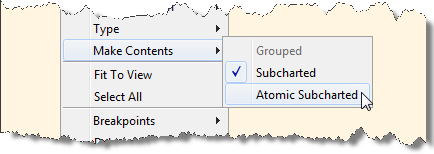
and the content of the state becomes atomic
One File Per Atomic Subchart
The next step is to store the state in a library. To do this, I copy the Atomic Subchart to a Simulink Library and recopy it back to the chart. Notice that the annotation on the state changes from Atomic to Link:
and that's it... I now have a Stateflow chart with different states stored in different files.
Data Mapping
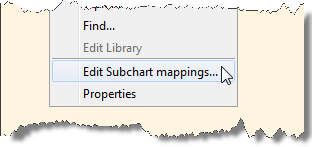
Now we have one more step to go. To use an Atomic Subchart, you need to map the data internal to the subchart to the main chart data. To accomplish this task, right-click on the chart and select Edit Subchart mappings...
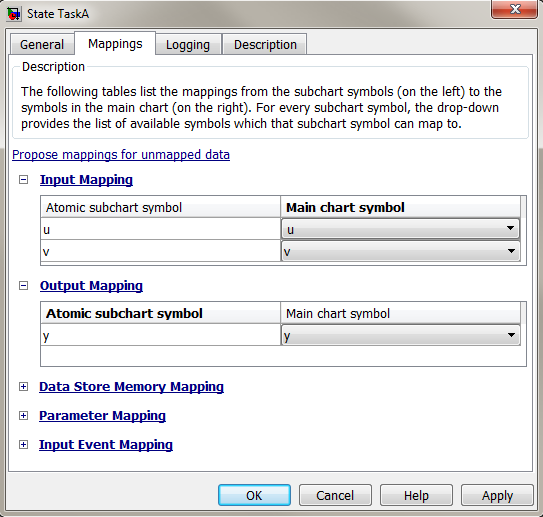
This will launch a dialog containing tables to map inputs, outputs, data store memory, parameters and input events.
Now it's your turn
Do you componentize Stateflow using Atomic Subcharts? Leave us a comment here.


댓글
댓글을 남기려면 링크 를 클릭하여 MathWorks 계정에 로그인하거나 계정을 새로 만드십시오.