
Accelerating the Simulink Debugger
This week I want to share a useful trick to save debugging time: Using the Simulink Debugger in Accelerator Mode.
Simulink Debugger in Accelerator Mode
Did you know that the Simulink Debugger can run in Accelerator Mode? If you need to investigate a problem that happens late in a simulation, this can be very useful. This can help you reach the problem significantly faster than executing in normal mode.
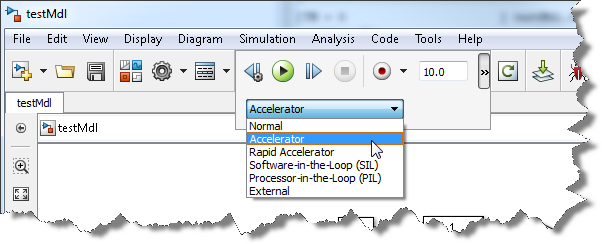
Start by setting your model to Accelerator Mode:
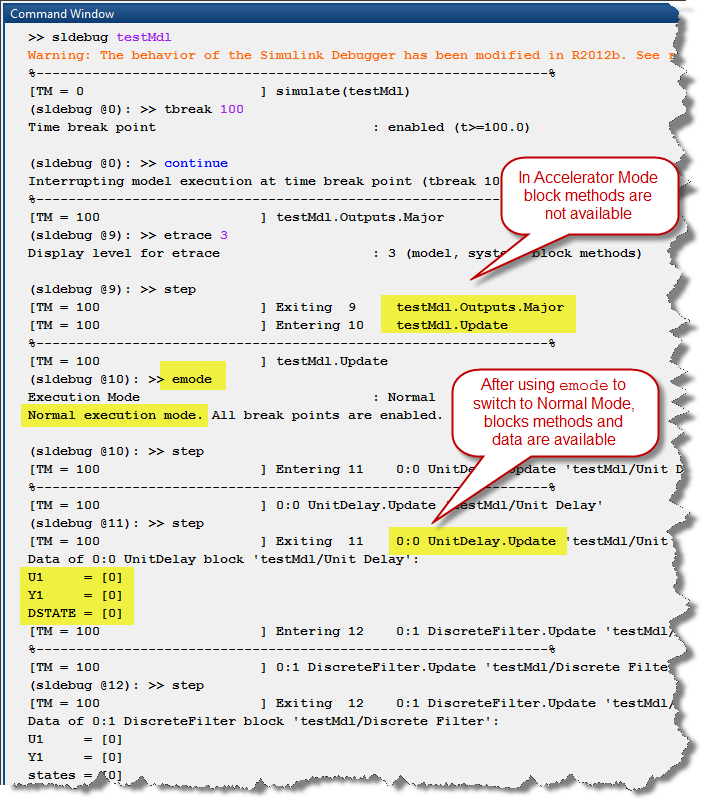
The functionality needed to toggle between accelerator and normal mode is accessible through the Simulink Debugger command line interface.
At the MATLAB command prompt, try the following:
- Start the debugger using sldebug
- Set a time breakpoint using tbreak
- Simulate until the breakpoint is reached using continue
- To see which block methods are available, we can increase the execution tracing using etrace 3
- While still in accelerator mode, step and observe that only model level methods are available
- Use emode to switch to Normal mode
- After switching to Normal Mode, we can step block by block and observe data for each block
Now it's your turn
Try accelerating your debugging and let us know how it goes by leaving a comment here.
- Category:
- Debugging


Comments
To leave a comment, please click here to sign in to your MathWorks Account or create a new one.