
Simulation Data Inspector in R2018a
Over the past few releases, many enhancements have been added to the Simulation Data Inspector. Let's look at a few of those I particularly like.
Browse Mode
By default, in the Simulation Data Inspector you select which signals are displayed by checking and unchecking a checkbox for each signal, or by dragging them on the axis onto which you want to plot them. Here is what it looks like for a simple example model.
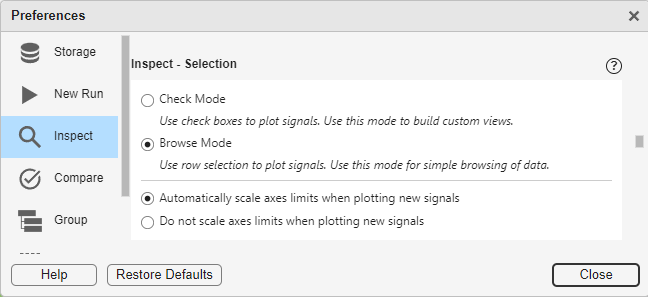
While this can be useful for some workflows, when I debug models, what I usually need is to scan a large number of signals as fast as possible. For that, we introduced Browse Mode. Here is how to enable Browse Mode:
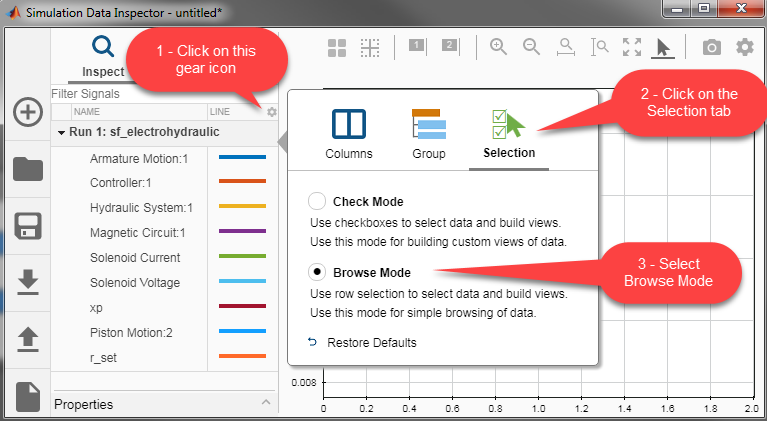
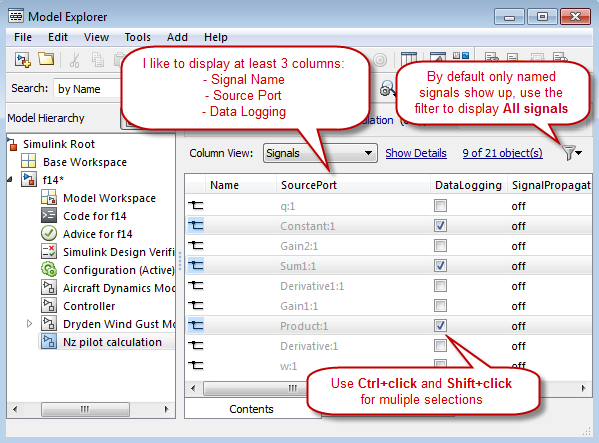
Now I can use the arrow keys to browse the signals, along with Ctrl and Shift keys for multi-selection like in most applications. Here is me browsing logged signals for the same model:
See this documentation page for more information on Browse Mode
Simscape Enhancements
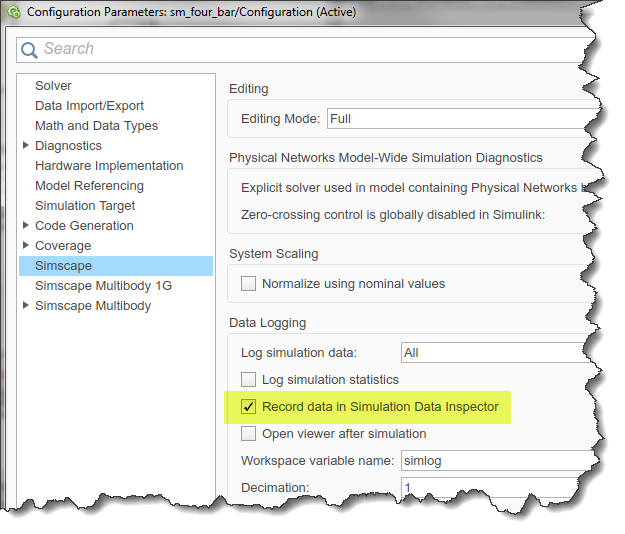
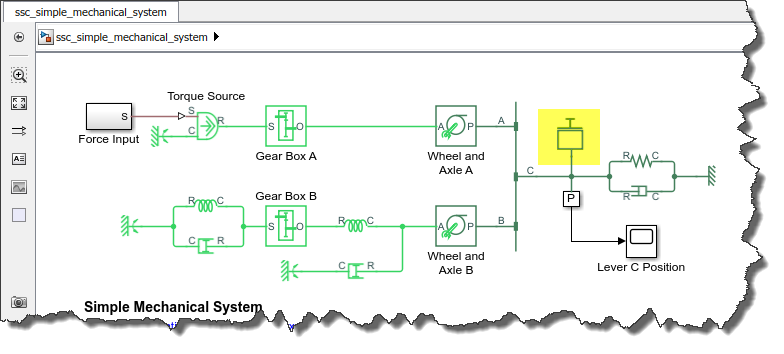
In R2018a, we added the possibility to directly record Simscape data in the Simulation Data Inspector. This can be enabled from the Simscape section of the model configuration:
Another capability that has been added to the Simulation Data Inspector is the possibility to visualize logged data in different units. If I enable the Units column in the signal list, I can see a list of commensurate units from which I can choose from.
Here is one more animation to demonstrate this feature. I have Simscape data logged in the Simulation Data Inspector, I chose to hide the column showing the line color, I enabled the Units column, and I grouped the signal using the Physical System Hierarchy, in Browse Mode:

Now it's your turn
Please share any features you use to improve your workflow in the Simulation Data Inspector in the comments below.
- Category:
- Analysis,
- Signals,
- What's new?


Comments
To leave a comment, please click here to sign in to your MathWorks Account or create a new one.