
Surprising Results from Modeling Queues with SimEvents
Today I am very happy to welcome guest blogger Ramamurthy Mani who works in our development organization.
Introduction
Have you ever been in a supermarket checkout and wondered why you are in the slowest line? When I saw this article in Wired magazine, the title immediately grabbed my attention. As I read the article, I knew I had to try to put the theory to the test in SimEvents — a discrete-event simulation add-on to Simulink that is suitable for modeling queuing systems.
Two Types of Queues
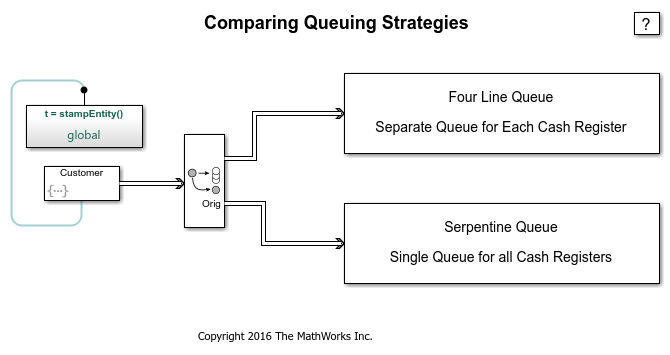
I started by building a simple model of a four register supermarket counter. I built two parallel versions of the setup — one which uses four separate queues and one with a single “serpentine” queue that feeds all four registers.

Let see how this is implemented in SimEvents.
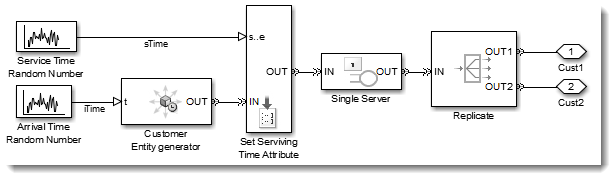
To get the simulation going, I need to model random customers entering the checkout area. I use entities in SimEvents to represent customers and I can generate these entities at random time intervals following an exponential distribution. During generation I can also specify a random duration (also exponentially distributed) that a customer will take to be served at a register by assigning a special attribute to the corresponding entity. I chose the average service time (usually denoted by $1/\mu$) to be 2 mins and the average arrival time (usually denoted by $1/\lambda$) to be 1 min.
I then clone each customer I generate so that I can exercise the two different line configurations identically.
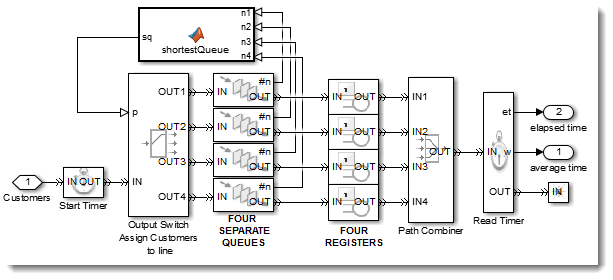
To model the case where four separate queues are feeding the four cash registers, I use a Switch that routes customers to the shortest of the four Queues. Each Queue then feeds a Server representing a checkout register. This Server holds the customer for the amount of time that was setup during generation.
To model the “serpentine” queue, I use a single Queue that feeds the four registers via a Switch that routes customers to a free register when one becomes available.
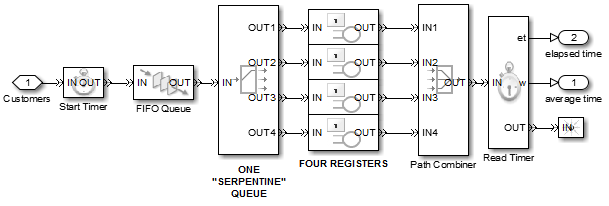
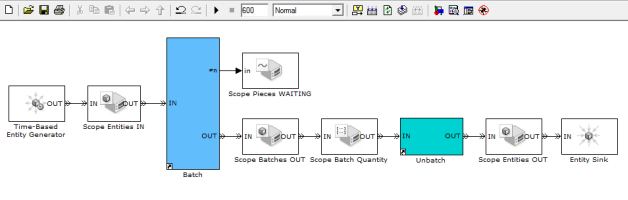
As you probably noticed, the two models use Timer blocks (the ones with the Stop Watch icons) that keep track of timing statistics for the entities/customers. This allows me to plot the average wait time of customers in the two configurations as well as the minimum and maximum wait times.
Simulation Results
Let us run the model and see what gets plotted.
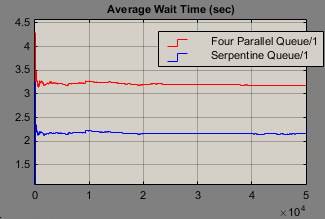
As you can see, the configuration with the four queues on average results in longer wait times!
Also heartening is that if we compare the results from SimEvents to the theoretical M/M/c queue solution, we can see that this matches pretty well with a result of 2.173913 seconds for the “serpentine” model:
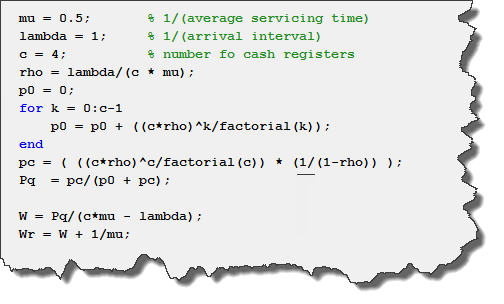
Note that there are some approximations (but no analytical results) for the average arrival time of the ‘shortest queue strategy’ as well, however I will not get into that for this blog.
Advanced Analysis
Once I had my model setup, also did some other fun experiments with it. I will not go into details in this post, but if you are interested you can download the model and associated files using the link at the end of this post and play with them. To pique your interest, I have summarized some of the interesting things I observed during my experiments:
- Measuring “Luckiness:: By assigning an ID to each customer, I tried to measure how often a “lucky” customer who arrives after a specific customer is able to reach a cash register before that “unlucky” customer. With the arrival and service times used above, I was surprised that only 13% of customers were running into an “unlucky” situation. I feel like this happens to me a lot more often in real life!
- Impact of system utilization: With an arrival time of 1 minute and service time of 2 minutes, the system utilization is 50%. If we drop the customer arrival time to ~30 seconds, then the system is utilization increases to ~95% and we see that 57% of customers become unlucky. Perhaps this explains what we saw during the recent Christmas season in the grocery store!
- Let’s try to be smart: : Up to now, customers in my model always picked the shortest queue. By measuring more statistics from SimEvents Queues and Servers, it is possible to always pick the “optimal” queue (where you have a perfect estimate of how long each customer will take at the register) and get the four queues system to perform exactly the same as the serpentine queue. Of course, no human can perfectly estimate the time it will take reach customer at a cash register. To represent this effect, we can add a bit of randomness to include the effect of human optimism bias to our simulation. When I do this, the serpentine queue wins out again.
- The dreaded “Price Check on lane 4”: “Price checks” have happened to all of us and these are another factor in the unpredictability of service times. In SimEvents, we can enable a “pause” input to the Servers and also model this effect. Once again when you do this, you begin to see that you are better off using the serpentine queue.
I never thought I would say this, but, based on these experiments, perhaps it is time to give airlines and banks their due – they do setup a single line for transactions.
Now it’s your turn
Download the final model and detailed description here, and let us know what you think by leaving a comment here.
- Category:
- Analysis,
- Guest Blogger,
- Modeling


Comments
To leave a comment, please click here to sign in to your MathWorks Account or create a new one.