
COVID-19: Simulating exponential spread in Simulink
Update (10/14/2020): The GitHub repository now contains a MATLAB App to simulate the model and visualize the results. We compiled the app as a MATLAB Web App and host it in the cloud using the MATLAB Web App Server.
Last week, my colleague Mariano Lizarraga Fernandez pointed me to the Washington post simulation of COVID-19 and we thought it would be interesting to implement something similar using MathWorks products.
Now that Cleve published a MATLAB-based simulator, it's time to for us to publish our simulation implemented using Simulink, Stateflow and SimEvents.
Here is what the results looks like for a random set of 50 "agents" (green is before infection, red is infected and blue is recovered):
Let's see how I put that together.
Extending the Curling Simulator
The first thing that crossed my mind when thinking about how I would implement this simulation is that I could probably reuse some of the algorithm I put together for the curling simulator I published some time ago.
With the dynamics of the stones bouncing against each other already implemented, I added bouncing against a boundary box and a logic to keep track of the infection propagation.
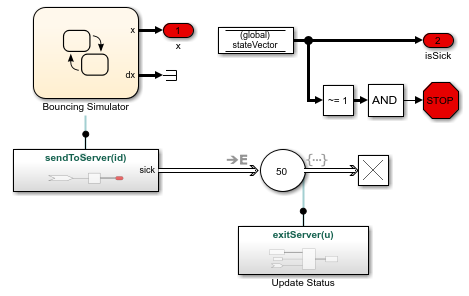
To begin, let's look at the top level.
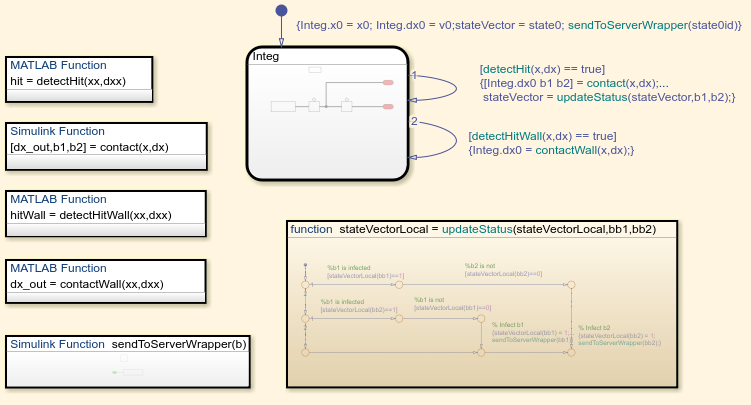
and here is what the Stateflow chart looks like:
The Details
Here is how it all works:
- Inside Stateflow, the Simulink State integrates the motion of the agents
- At every time step, we call a MATLAB function to detect if an agent hit one of the border walls. If one agent did, we invert the sign of its velocity in the wall direction and re-initialize the Integrator block in the Simulink State with this updated velocity.
- At every time step, we call a MATLAB Function to detect if two agents get into contact. If they did, we compute the new velocities using a Simulink Function and reset the Integrator block in the Simulink State.
- When that happens, we call a Stateflow Graphical function to determine if the infection gets propagated. To keep track of who is infected, we use a global Data Store
- If we determine that a new agent has been infected, the Stateflow chart calls a Simulink Function that generates a SimEvents Entity
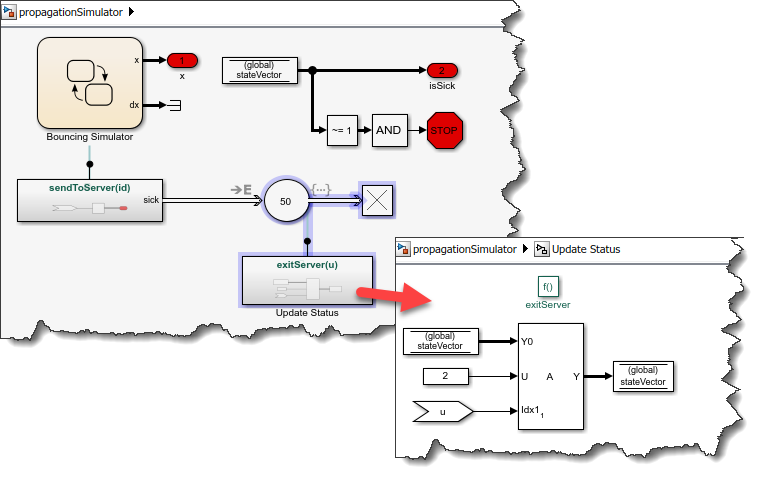
- This entity is sent to a an Entity Server for a fixed amount of time to recover.
- Once the recovery time is over, the Entity Server exit action calls a Simulink Function that updates the global data store accordingly.


The Results
Here is a different result where I reduced the initial speed of the agents. It's interesting to see the impact on the propagation:

Now it's your turn
Download our simulator on MATLAB Central or directly from GitHub and let us know what you think.
- Category:
- Community,
- Stateflow


Comments
To leave a comment, please click here to sign in to your MathWorks Account or create a new one.