Creating Custom Gauges
This week, I have a gift for you!
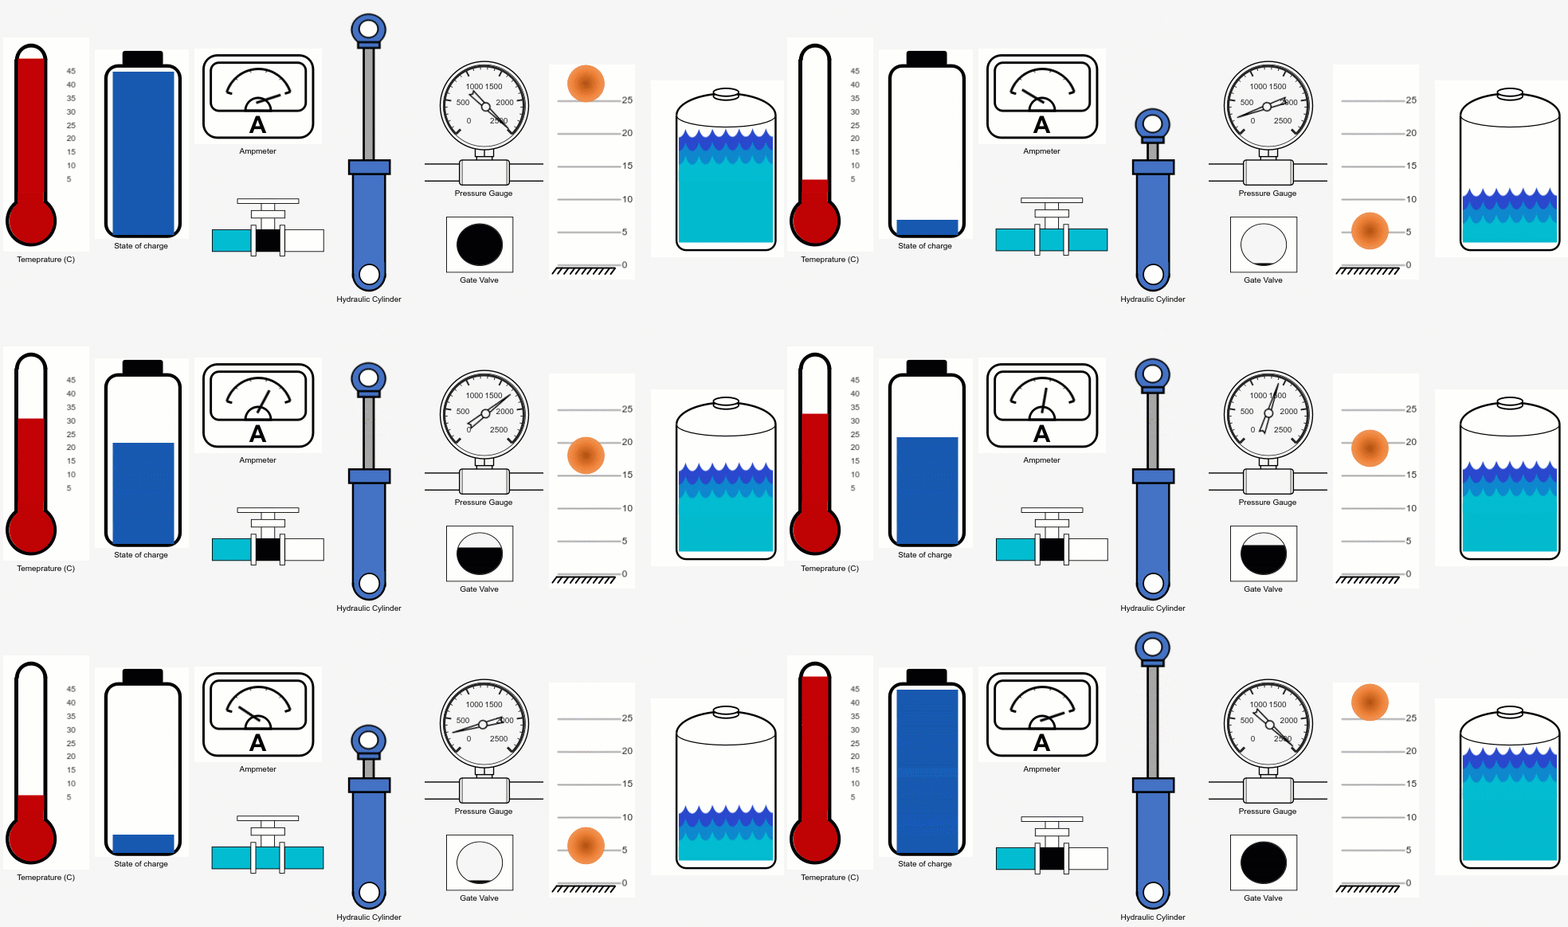
Thanks to new capabilities added in MATLAB R2020b, I created a library of custom gauges that you can add to your Simulink models and published it to MATLAB Central and GitHub.
Here is what my collection of gauges looks like, all together in action:

Let's look at a few examples illustrating how you can create such custom gauges yourself.
Example 1: Battery State of Charge
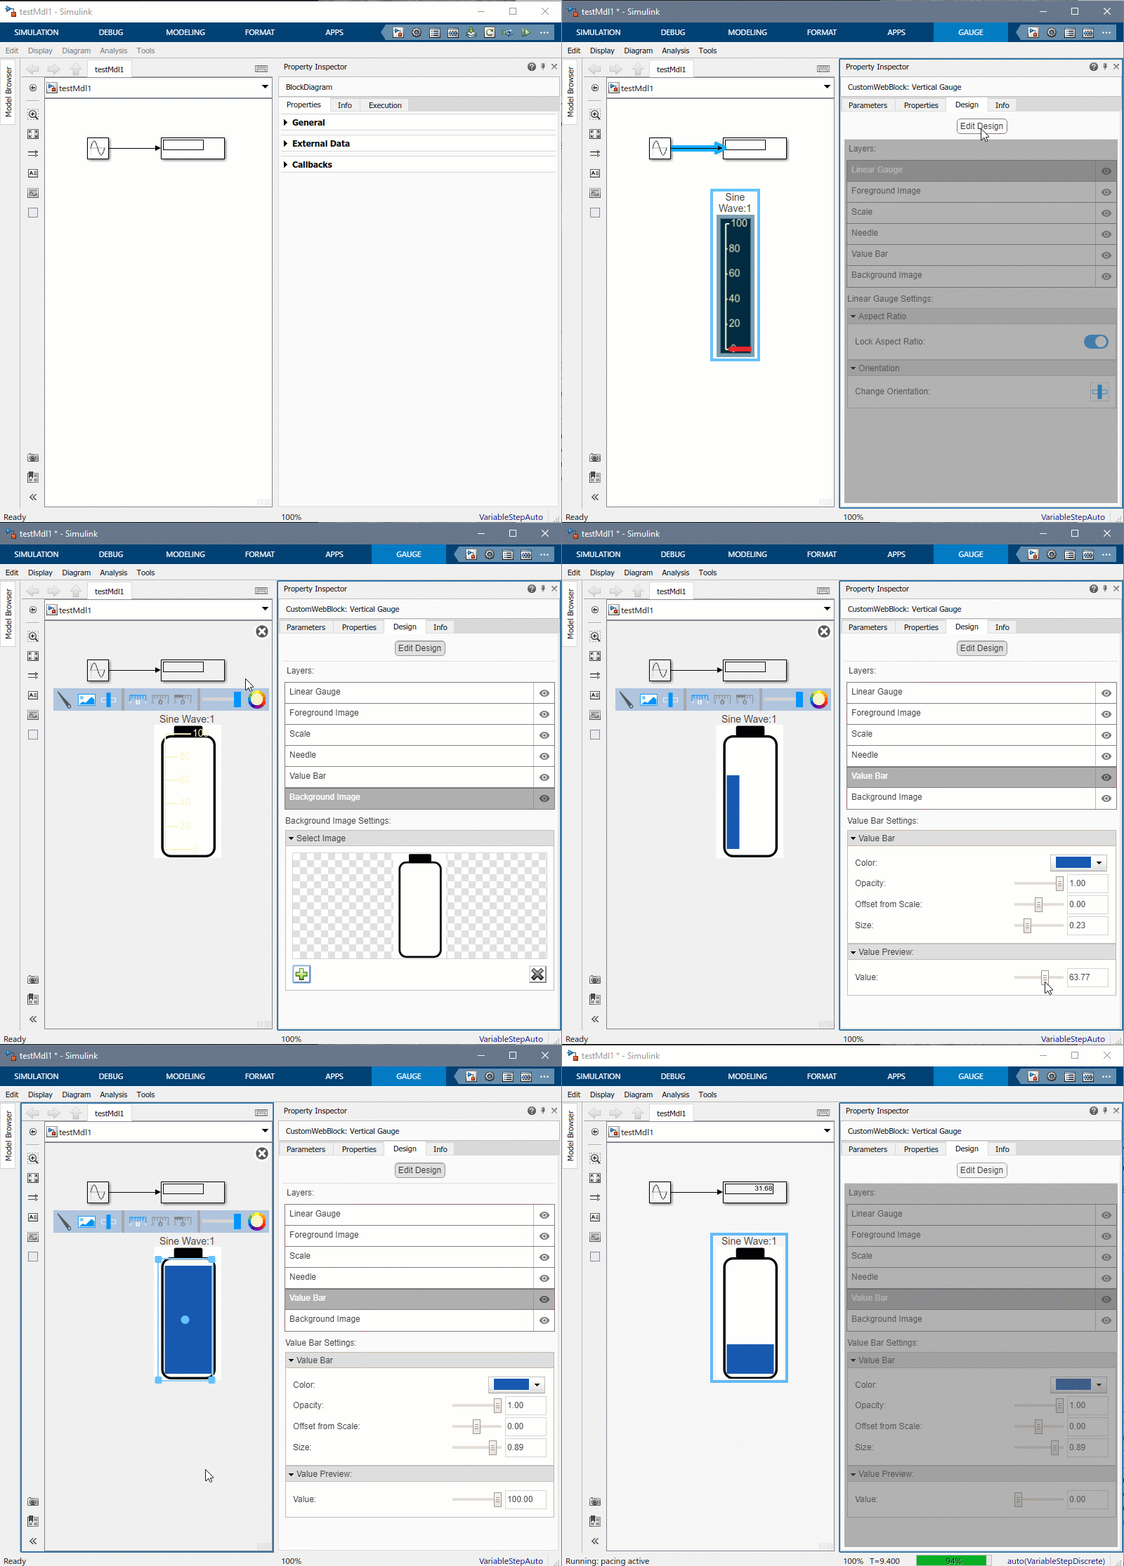
Here is an animation showing how I created the battery-looking State of Charge gauge shown above. The steps I went through can be summarized as:
- Add a vertical gauge to the model
- Connect the vertical gauge to the signal of interest, the output of the Sine Wave block in this case
- Select the gauge in the canvas and in the Property Inspector, click Edit Design in the Design tab
- Remove the default needle image (my battery does not need a needle)
- Replace the default background by a scalable vector graphics (SVG) image. Note that I used Microsoft PowerPoint to create this image and saved it in SVG format
- In the Scale sub-menu, I disabled the ticks, span line, and labels, since I don't need those for my battery
- In the Value Bar sub-menu, I used the Value Preview to see how the Value Bar looks for different values and I adjusted its dimensions to fit my background image

Example 2: Bouncing Ball
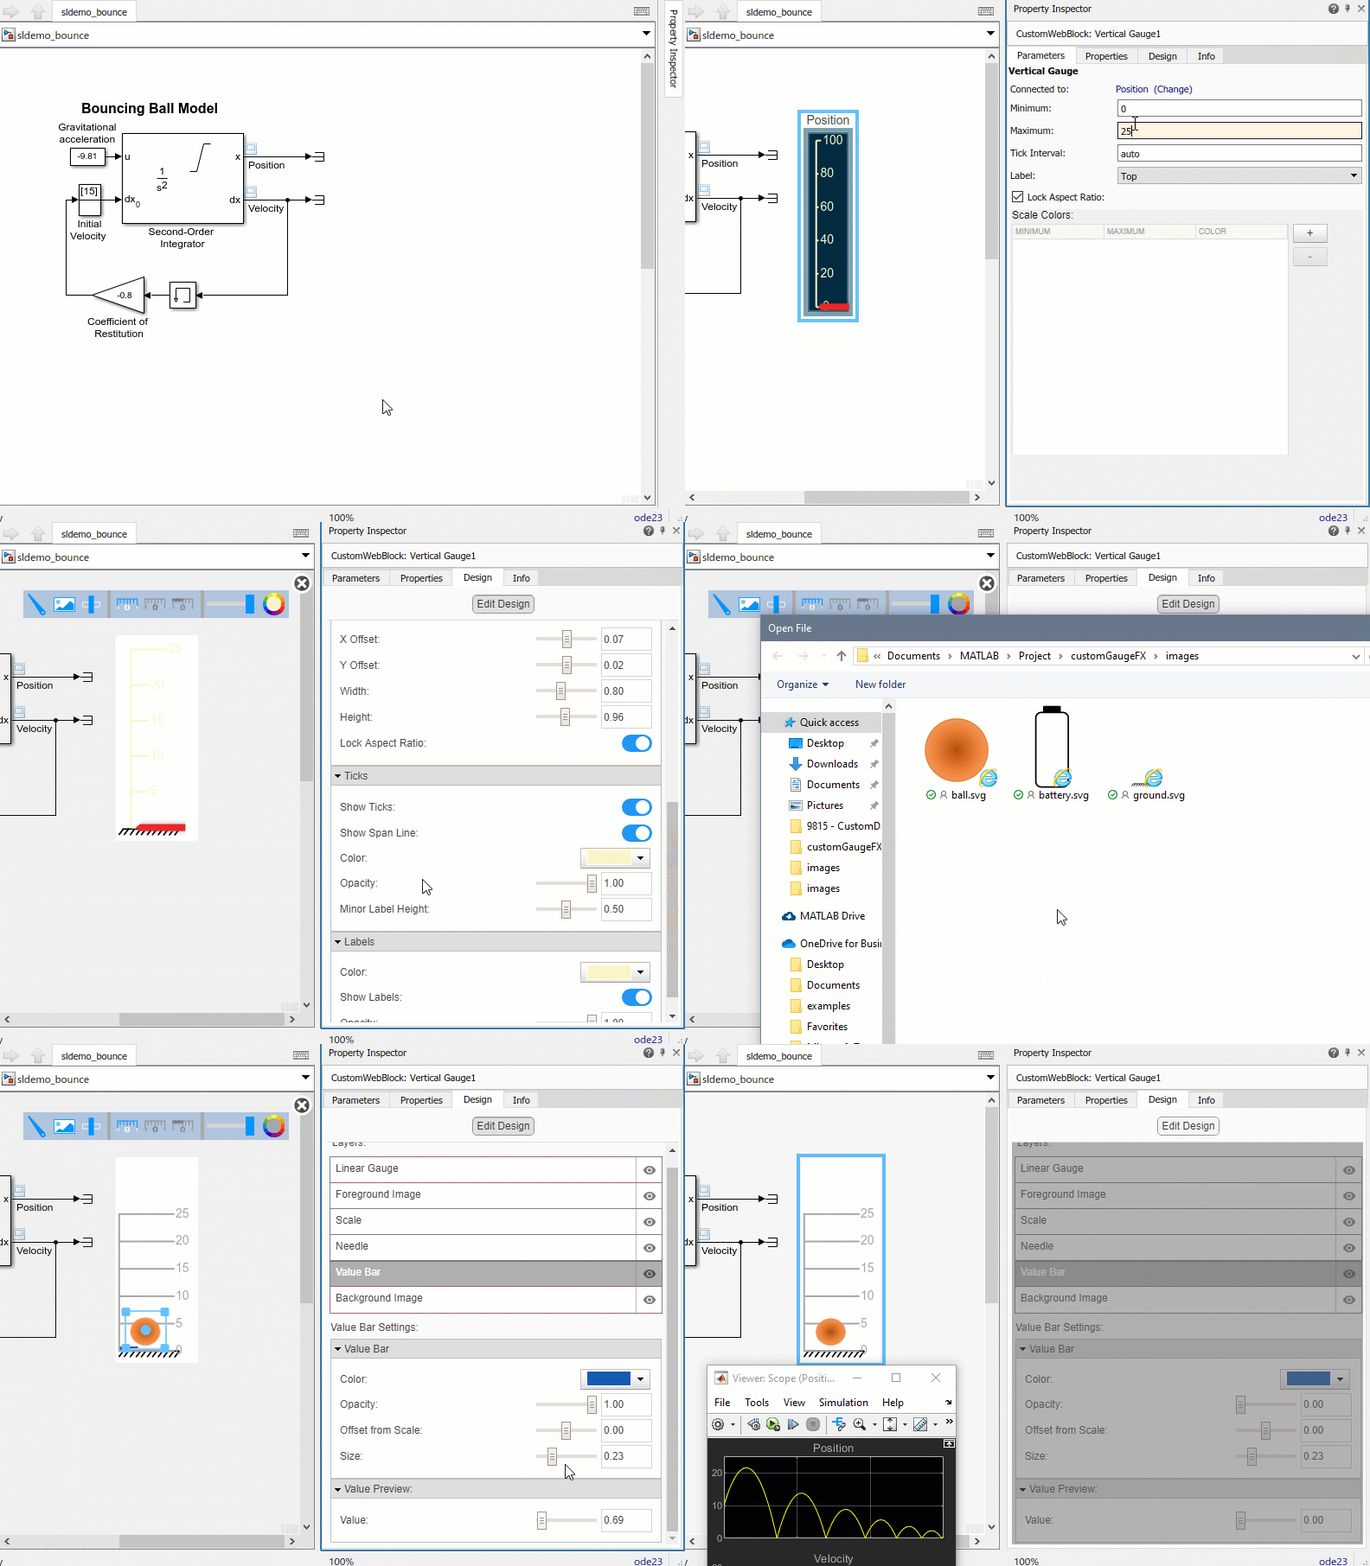
For this second example, I created a gauge to animate our bouncing ball example. After adding the Vertical Gauge and connecting it to the desired signal, I:
- Replaced the default image with a "ground" on which the ball will bounce. As in the previous case, I created the SVG image using Microsoft PowerPoint and saved it in SVG format
- Specified the desired color for the ticks, span line, and labels
- Positioned and resized the scale
- Replaced the needle image with a ball image I created
- Confirmed that everything moves as expected using the Value Preview

Example 3: Gate Valve
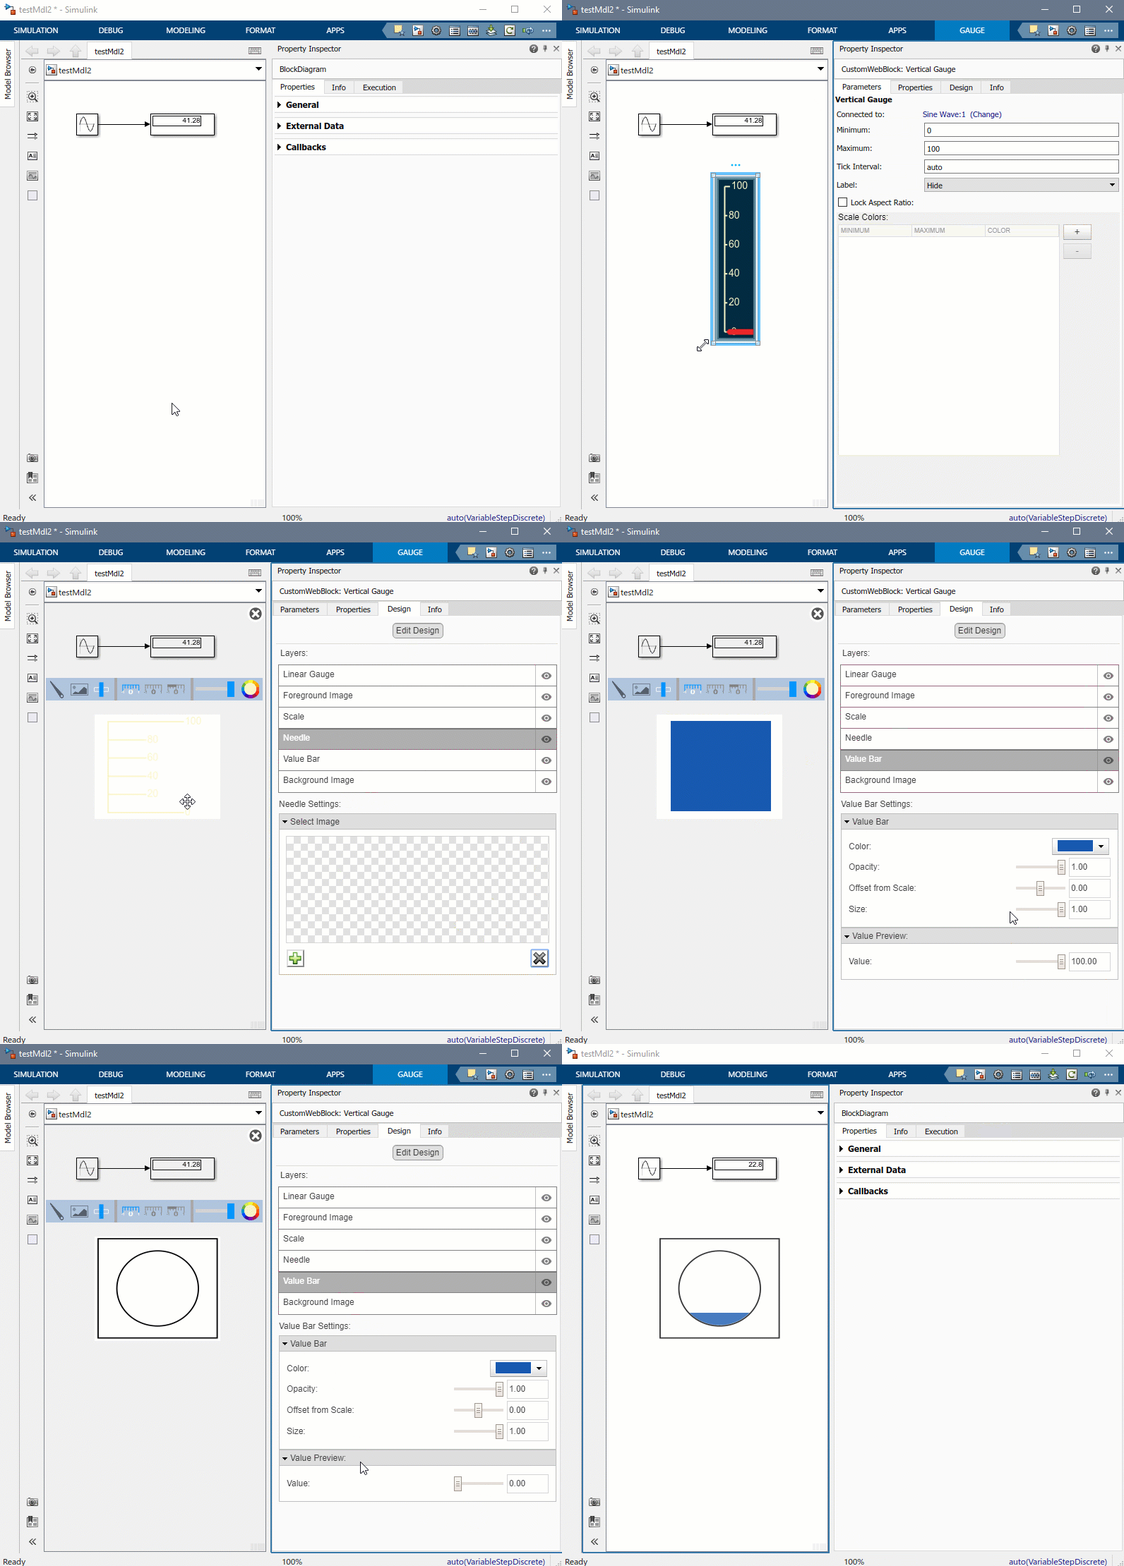
In this third example, I want to highlight how you can use a foreground image to create a mask on top of the value bar. This allows creating, for example, a circular hole that opens and closes. After adding the gauge and connecting it to a signal I:
- Removed background image, needle image, ticks, span line, and labels
- Positioned and resized the scale
- Added a foreground image with a transparent hole
- Confirmed that everything moves as expected using the Value Preview

Note that in all those examples I used Simulation Pacing to slow down the simulation such that we can see the gauges being animated at a reasonable speed.
Now it's your turn
Download my library of custom gauges from MATLAB Central or Github, or try creating your own custom gauges in MATLAB R2020b. Let us know how it went in the comments below.
- Category:
- Community,
- What's new?
 Cleve’s Corner: Cleve Moler on Mathematics and Computing
 The MATLAB Blog
 Guy on Simulink
 MATLAB Community
 Artificial Intelligence
 Developer Zone
 Stuart’s MATLAB Videos
 Behind the Headlines
 File Exchange Pick of the Week
 Hans on IoT
 Student Lounge
 MATLAB ユーザーコミュニティー
 Startups, Accelerators, & Entrepreneurs
 Autonomous Systems
 Quantitative Finance
 MATLAB Graphics and App Building


Comments
To leave a comment, please click here to sign in to your MathWorks Account or create a new one.